Primary sources cited
This article links directly to the primary documentation, paper, filing or original reporting used for its material claims.
National brands, private labels and retailers face a new contest over AI recommendations.
Measuring the relationship between human preference, machine recommendation and actual choice is the next useful step.
Author: Ian Ash
Published: November 15, 2026
Category: Analysis
A grocery brand can win a shopper’s loyalty and still miss an assistant’s shortlist. Equally, it can earn a recommendation without entering the basket. That gap, rather than an imminent autonomous takeover of the aisle, is the strategic issue for national manufacturers, private labels and challengers. The evidence available on 15 November 2026 supports treating AI as another route into product discovery; it does not establish that AI caused private-label growth or national-brand decline. Measuring the relationship between human preference, machine recommendation and actual choice is the next useful step. [18]
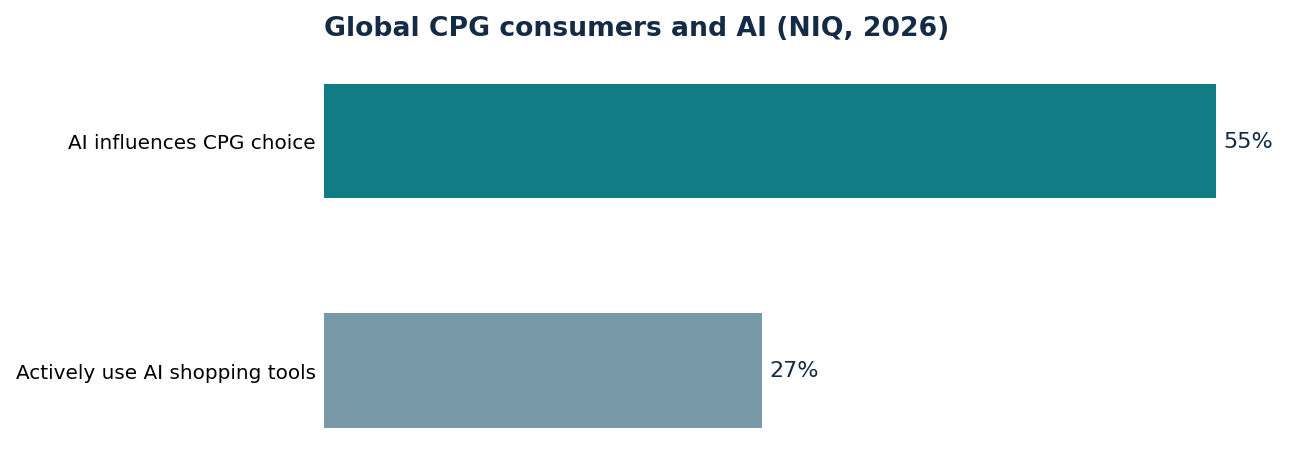
NIQ’s 7 October 2026 release reports that 55% say AI recommendations at least sometimes influence their household and grocery purchases. A separate 27% report actively using AI-powered tools or assistants to research or decide what to buy in the previous three months. The overall survey covered more than 21,000 respondents across 31 countries, but the reviewed materials do not disclose the valid-response base for either AI item. The 55% combines reported occasional and more frequent influence, with no explicit recall window; the 27% concerns general shopping-tool use, not verified grocery-only activity. [2]
These are different measures, not successive stages in an adoption funnel. Neither establishes autonomous payment or sales attributable to AI, and the overlap between the groups is unknown. For marketing leaders, the distinction changes the brief: investigate how recommendations enter consideration, rather than assume that a reported influence percentage describes consumers handing over their weekly shop. [2][18]
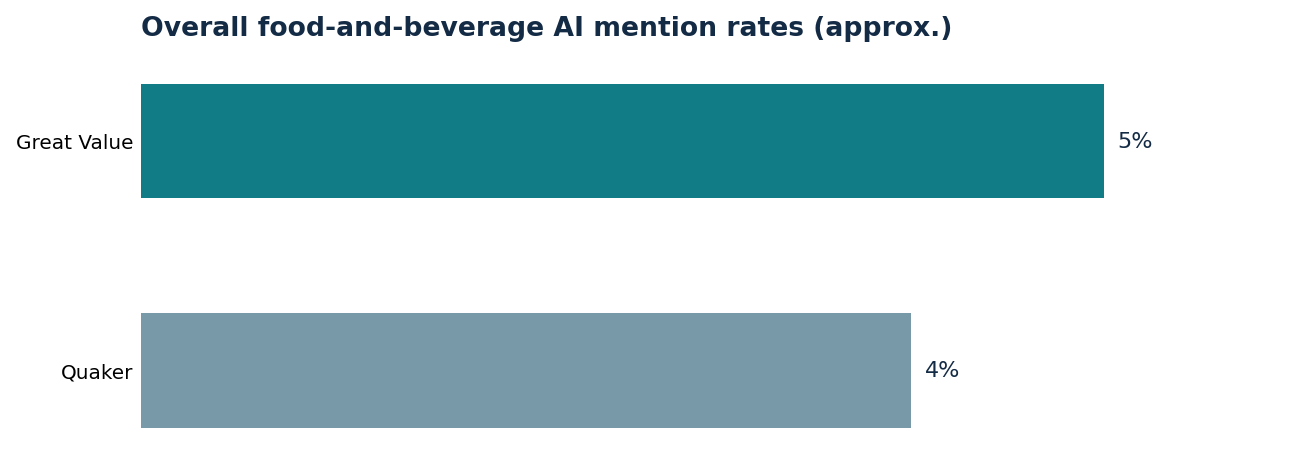
EMARKETER’s September-dated July 2026 leaderboard analysed 7,460 ChatGPT recommendations across 16 food-and-beverage categories, using US-based standardised product-recommendation interactions. It reports Great Value at a 5% overall mention rate and Quaker at 4%, the highest-ranking manufacturer brand rather than the overall leader. The source does not disclose the precise rate denominator or weighting, so these whole-percentage figures cannot support invented exact counts. They measure mentions under the benchmark’s conditions, not consumer preference, citation share or market share. [3]
A separate EMARKETER article dated 13 August reports Great Value at around 5.5% and Whole Foods Market at 4.3%. That presentation remains unreconciled with the currently linked leaderboard; it should not be described as rounding or a measured trend. The August article also says only one of the nine displayed category breakdowns included a private label in the top five, not one of all 16 measured categories. Broad visibility and category-specific strength therefore need separate interpretation: national manufacturers should examine the needs for which they are recommended, not concede the contest because a store brand leads an aggregate table. [4][18]
The competitive hypotheses differ. A private label could benefit when a shopper prioritises a retailer’s value promise and a basket tied to that retailer. A national manufacturer could defend a premium through perceived taste, reliability or a verifiable nutritional benefit, while a challenger could target a narrower unmet need. None is an automatic recommendation advantage. The useful comparison holds the shopping job constant, then tests whether price, product evidence and existing consumer preference change the shortlist or subsequent choice. That preserves brand strategy within AEO rather than reducing competition to data-feed access. [18]
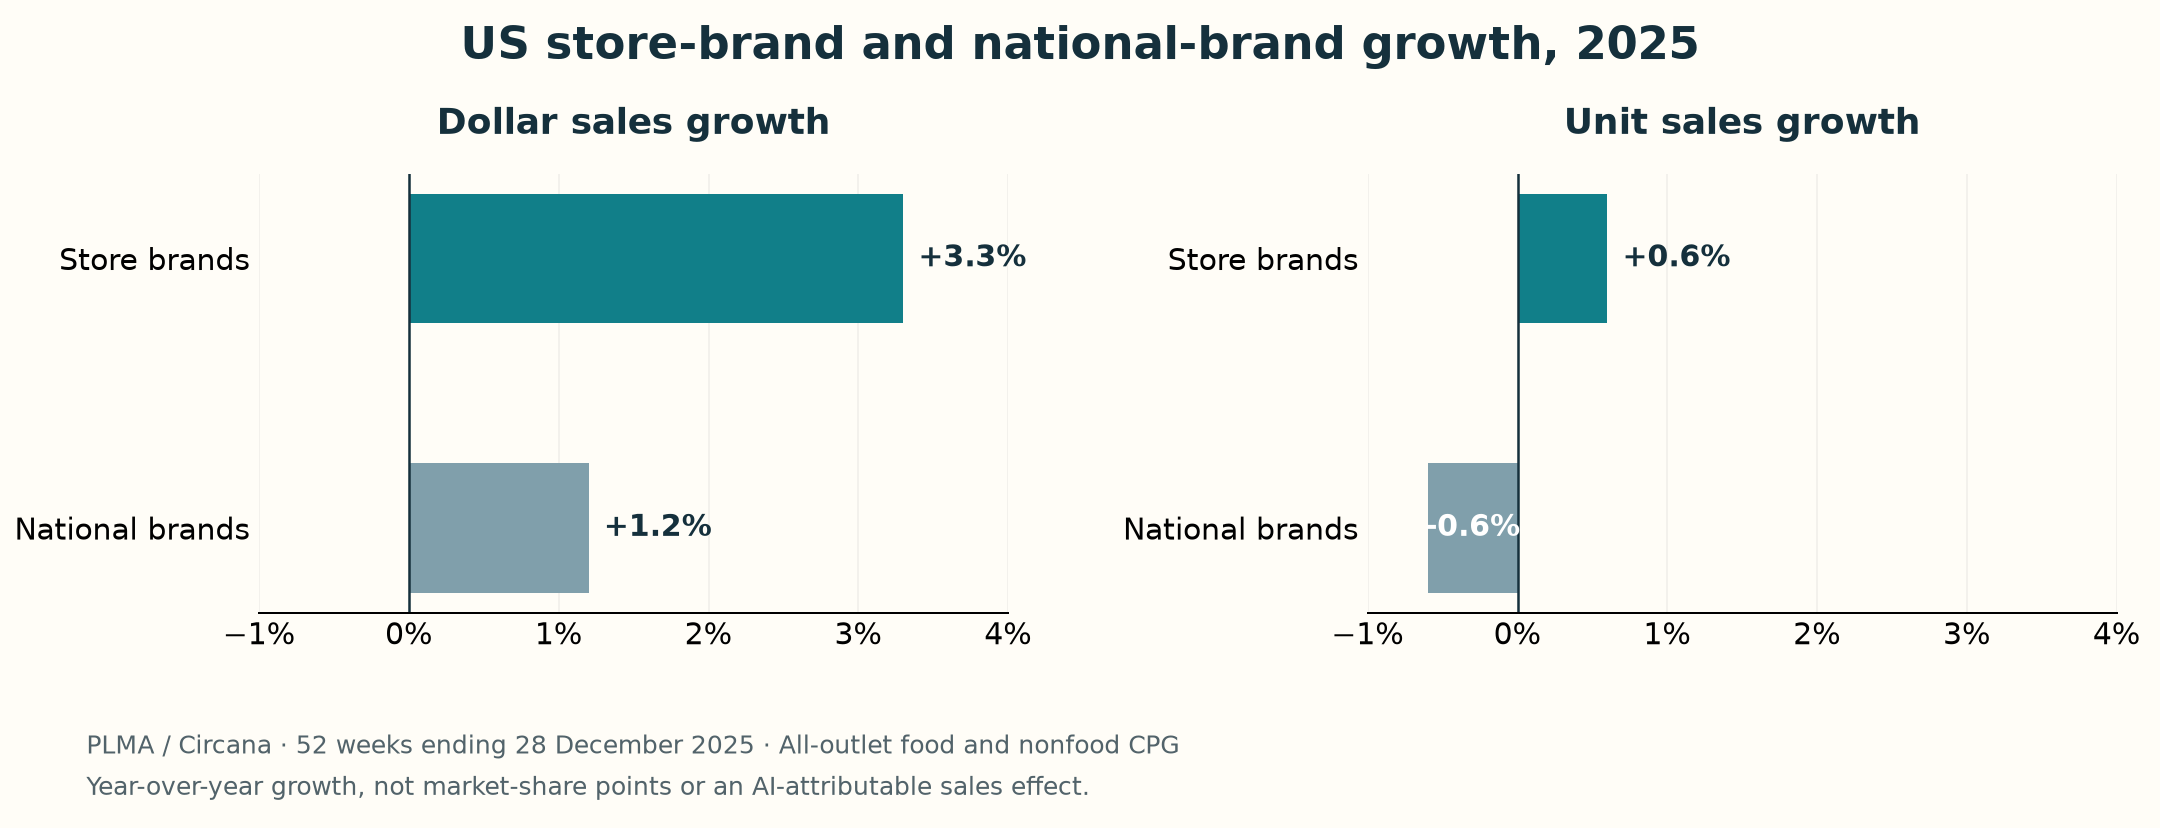
PLMA, using Circana data, reports US store-brand sales of US$282.8 billion in 2025 across all-outlet food and nonfood consumer packaged goods, not food-only grocery. Over the 52 weeks ending 28 December 2025, store-brand dollar sales grew 3.3%, against 1.2% for national brands. Store-brand units rose 0.6%; national-brand units fell 0.6%. These are year-on-year sales measures, not inflation-adjusted growth or evidence that AI transferred purchases between brand types. [5]
NIQ’s separate March 2026 release reports that established niche brands gained 1.5 percentage points of US market share from 2022 to 2025, while large and mid-size national brands lost 2.1 points. Its retail measurement spans all categories, not grocery alone, and the reviewed release does not specify whether share is measured by value, units or volume. Neither those movements nor PLMA’s figures identify an AI effect. The defensible hypothesis is that assistants could interact with existing value and differentiation pressures, not that they created them. [1][5][18]
Commerce connections matter, but the chronology needs care. Walmart’s 14 October 2025 announcement described plans for shoppers to purchase through ChatGPT, not a live launch. OpenAI’s 24 March 2026 update confirmed a specific Walmart app environment in web browsers, with account linking, loyalty and Walmart payments; iOS and Android access was forthcoming. That same update emphasised product discovery through merchant feeds and merchant-owned checkout. Supplying a feed does not guarantee prominence or recommendation. [9][17]
Instacart announced embedded grocery shopping and checkout inside ChatGPT on 8 December 2025: users sign in, review a cart and pay. Its syndicated launch release described web checkout, with native checkout and Apple Pay/Google Pay forthcoming; the current company page describes those capabilities as supported, without establishing their completion dates. Separately, its 9 September 2026 Cart Assistant announcement covered grocers’ own websites and apps, analysing each grocer’s catalogue and customer data. Three retailers or groups were already live and four were to follow. That is not a guaranteed real-time inventory view, and later rollout completion is not established here. [7][8]
BCG’s 21 October retailer study illustrates another gate: 42% of surveyed retailers structured product data for discovery and retrieval by any agent, 32% offered selective direct-feed access, 6% blocked access and 20% were still deciding. The research covered 50 of the top 300 global retailers and a separate 100 top global brands; the retailer percentages are not based on a pooled 150 organisations. These are reported access positions, not audited openness or proof of own-brand favouritism. Manufacturers should test whether a product survives retailer-specific assortment and budget constraints rather than assume a neutral route into every basket. [10][18]
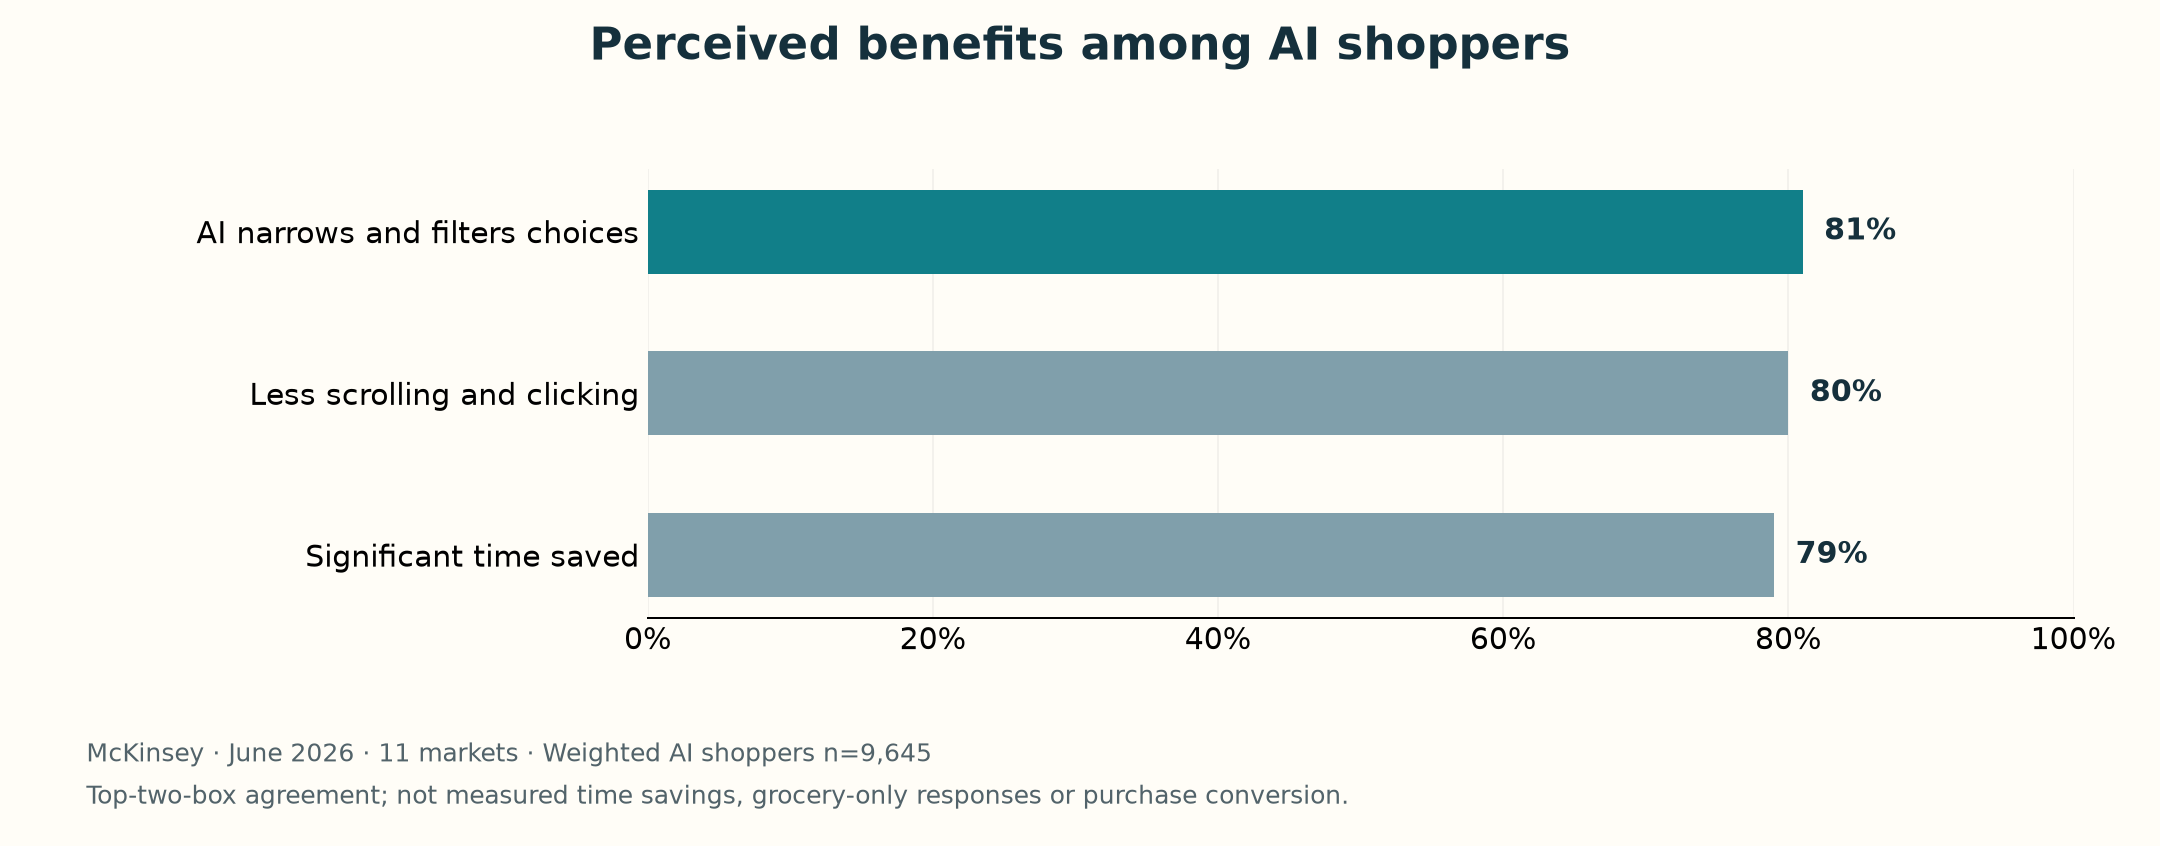
McKinsey’s 28 October research, fielded in June 2026 among approximately 21,000 consumers across 11 markets, reports that 53% on average across surveyed countries used AI for at least one shopping task in the past three months. That exhibit has a weighted adult base of 9,988, not the full study total. Among weighted AI shoppers, n=9,645, 81% agreed that AI narrows and filters choices effectively, 80% cited less scrolling and clicking, and 79% cited significant time saved. These are top-two-box agreement measures on a five-point scale, not observed performance or grocery-only benefits. [11]
The study includes self-reports of purchases completed within AI tools, but those are not independently verified transactions. Its US purchase exhibit uses weighted AI users, n=987, rather than all US shoppers. This analysis does not publish inaccessible precise grocery purchasing-chart values. For a US research programme, the priority is to test whether reduced search effort reinforces familiar replenishment or encourages substitution, with documented outcomes rather than an assumed conversion uplift. [11][18]
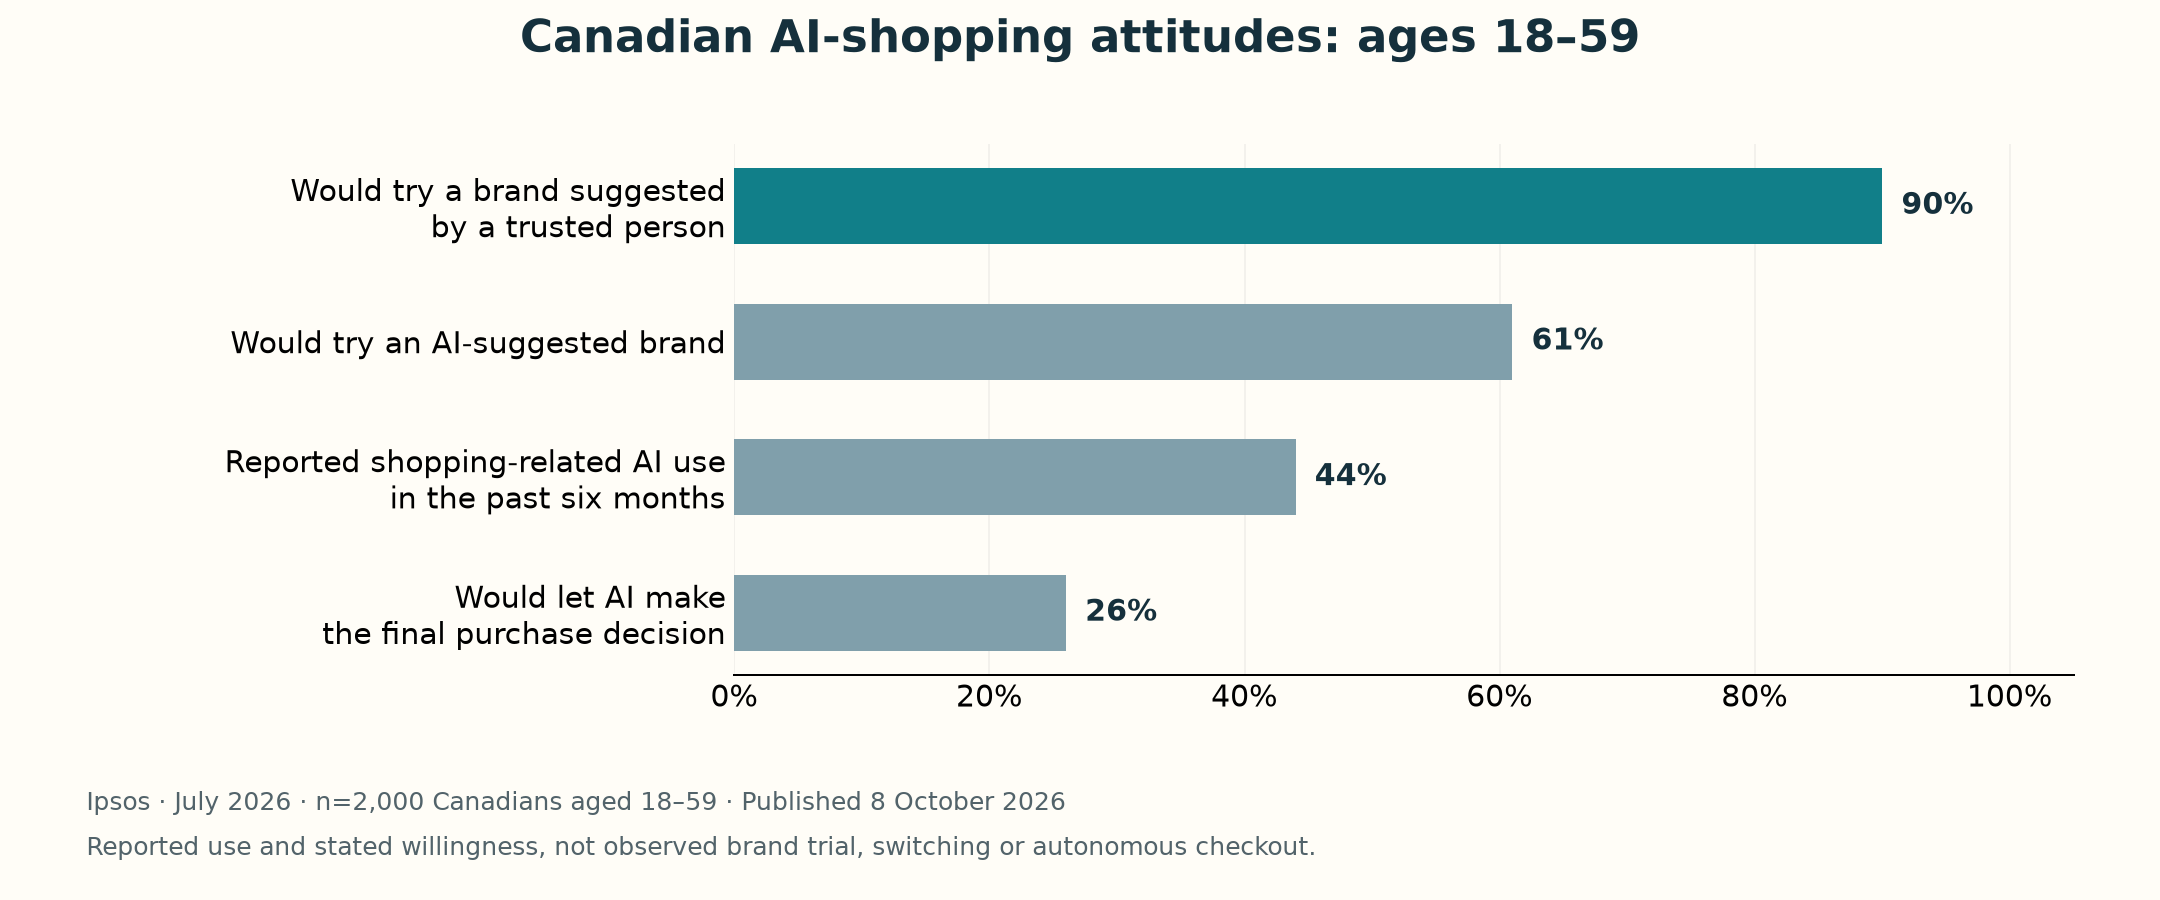
Ipsos’ July 2026 wave surveyed 2,000 Canadians aged 18–59. It reports that 44% used AI for a shopping-related task in the previous six months, not necessarily grocery purchasing. In the grocery-assistant framing, 61% would try an AI-suggested brand, compared with 90% on a trusted person’s recommendation; 26% would let AI make the final purchase decision, not necessarily complete checkout autonomously. Those willingness measures are not observed trial. A separate Caddle/Retail Council of Canada report dated February 2026, on a webpage published 26 March, reports 28% using AI tools to help decide what to buy, from a screener of 8,768 Canadian shoppers. Fieldwork dates are undisclosed, and it cannot establish a matched adoption trend against Ipsos. [12][13]
Canada’s Competition Bureau reported on 3 September 2026 that most Canadians buy groceries from Loblaw, Sobeys, Metro, Costco or Walmart, without providing a combined market-share percentage. Citing the Bank of Canada, it describes about 22% cumulative grocery-price growth from 2022 to 2025, versus 13% for other consumer prices, not annual inflation. That context makes retailer-specific budget tests relevant; it does not show that concentration caused inflation or that AI will intensify either. [14][18]
NIQ’s Canadian private-label material adds perceptions rather than an AI explanation. In research fielded from December 2024 to January 2025, 42% said they were likely buying more private-label goods than ever before, retaining the report PDF’s qualifier; 72% perceived good value and 68% saw good alternatives to name brands. The Canadian and item-level bases are undisclosed. These broad private-label self-reports are not measured purchasing growth, objective quality equivalence or AI-caused switching. Canadian tests should use country-specific products, retailer assortments and prices rather than import a US leaderboard. [15][18]
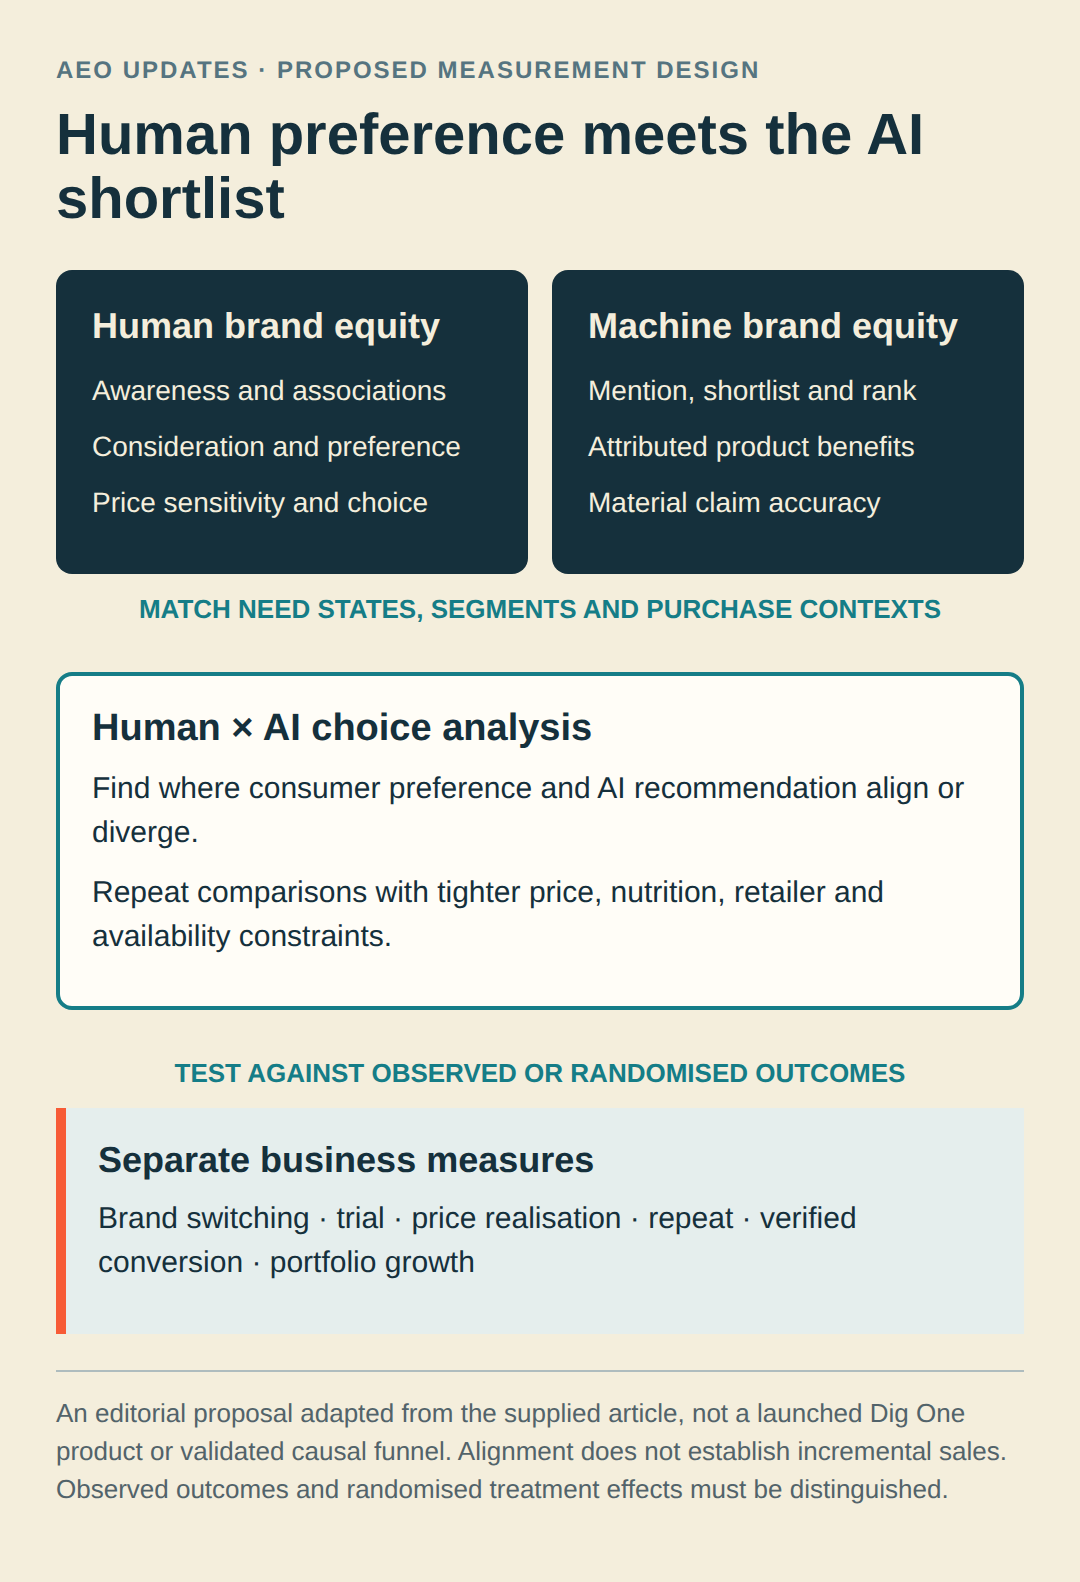
Human brand equity concerns familiarity, associations, trust, consideration and preference. This article proposes ‘machine brand equity’ as a complementary editorial concept: how consistently a system recognises, accurately describes and recommends a brand for defined needs. It is not an established or validated industry standard. The two lenses could reveal alignment or friction: strong human preference with weak AI recommendation suggests a question to investigate, while strong AI recommendation with weak human preference suggests a possible trial opportunity, not a sales forecast. [18]
Deloitte’s June 2026 Perspective supports the practical focus on structured, verifiable product information, pricing, inventory, policies and fulfilment readiness. Its ‘algorithmic shelf’ is a strategic model, not a tested universal ranking formula; its cereal-filtering example is illustrative. Deloitte warns that products could lose consideration and that retailer logic may prioritise availability, efficiency, margin or private label, while retaining the importance of brand investment. Product-data work and consumer persuasion should therefore be tested together, not presented as substitutes. [6][18]
A useful proposed audit would begin with named need states. Compare national and store-brand peanut butter for a family seeking low cost per serving, then add no-added-sugar requirements, a specified retailer, a basket budget and a delivery or collection condition. Run taste-led and nutritional scenarios separately, and use the correct product versions in each market. If a school-lunch scenario introduces a nut restriction, the test should check whether the assistant rejects peanut butter and offers an appropriate alternative, rather than reward unsafe persistence on a shortlist. [18]
Record why each product appears and why it disappears as constraints tighten. Did a legitimate ingredient mismatch exclude it, did a supplied price break the budget, or did the assistant invent availability? Check dietary and ingredient assertions against authoritative product information, and validate stock separately where access permits. Nothing in this design assumes that an assistant can see live inventory. A visible but false suitability claim is an accuracy problem, not a marketing win. [18]
A proposed Dig One CPG AI Choice Index could pair human research with standardised machine-response observation around matched needs, segments and purchase contexts. The proposed offering has not launched, and no existing capability, client outcome or vendor superiority is asserted. Its research brief would connect category-level visibility, recommendation strength, attributed positioning, human preference and experimental choice, keeping each as a separate outcome rather than hiding disagreements inside a composite score. [18]
Commercially, the proposition would be decision intelligence: identifying where product information needs correction, where a premium needs better justification, and where retailer access rather than brand weakness constrains choice. An index would earn credibility by publishing definitions, market coverage, omissions and repeatability, then testing its relationship with outcomes over time. It should not be marketed as a validated sales predictor before that validation exists. [18]
An illustrative, unexecuted AI baseline would run 100 grounded prompts across five systems daily for 30 days: 15,000 prompt executions per market. Applying that specification separately in the US and Canada means 15,000 in each, not a shared country pool. Pre-register the prompt taxonomy, products, competitor sets, interface, geography, retailer context, personalisation state and model versions, and preserve responses and collection times. Repeated executions are not independent consumers, organic traffic or natural exposure; dependence and model changes need explicit treatment. [18]
A parallel proposed human study would recruit 2,400 category-eligible adults in each country, with suitable quotas and weighting. Measure awareness, associations, consideration, preference, purchase history, price sensitivity, reported AI use and willingness to switch under matched scenarios. That target is a design parameter, not a claimed confidence level or guaranteed precision. Category and segment bases, weighting and experimental effect sizes must determine the eventual precision assessment. [18]
For causal questions, randomly assign eligible participants to unaided product choice, an AI recommendation, or equivalent non-AI comparison information with matched products and facts. The AI-versus-unaided contrast tests the combined recommendation package; the AI-versus-equivalent-information contrast helps isolate what the AI presentation adds. Pre-specify outcomes such as brand selection, switching, confidence and willingness to pay, ideally with incentive-compatible choices or separately consented, verified transactions. Questionnaire purchase reports remain self-reports. Randomisation can support bounded treatment-effect estimates, not automatic generalisation to the entire grocery market. [18]
The proposed dashboard would define relevant recommendation share as qualifying brand recommendations divided by all qualifying recommendations in a declared competitive set. Top-three inclusion would use valid matching executions as its denominator; first-choice rate would distinguish explicit first endorsement from simple list order. Need-state coverage would count predefined needs producing qualifying recommendations, with weighting stated. These proposed metrics describe monitored conditions, not the percentage of real shoppers reached. [18]
Machine claim accuracy would compare correct material product assertions with all audited assertions, preserving unknowns and serious dietary errors separately. Recommendation survivorship would measure how often initially shortlisted products remain after added constraints, distinguishing appropriate exclusions from data failures. Human–AI choice agreement would compare a participant’s stated preference with the top recommendation in the matched scenario, without treating agreement as proof of persuasion. [18]
Experimental switching lift would report differences between the randomised AI arm and each control, with appropriate uncertainty and subgroup bases. Observed conversion, repeat purchase and basket value should enter only where separately documented. Publish variability across days and systems, address repeated-prompt dependence and disclose missing responses. A score should not become a validated revenue forecast merely because its components look precise. [18]
National manufacturers could use this approach to locate gaps between intended positioning, consumer associations and AI descriptions, test pack-price thresholds, and support distinctive benefits with evidence. Challengers could investigate specific needs where their proposition fits better, without equating a low overall mention rate with failure. Retailers could audit whether their assistants explain relevant alternatives accurately within the available assortment. For both sides, negotiations should separate product relevance from feed access, local availability and basket economics; own-brand preference remains a hypothesis to test, not an established property of every retailer assistant. [18]
BCG’s 30 October CPG paper reports that 59% of US CPG companies lacked meaningful agentic AI capabilities, but the relevant denominator is undisclosed. It also reports incremental revenue increases of 1%–5% among CPG companies piloting generative engine optimisation, without disclosing pilot counts, horizons, baselines or causal controls. That range is a reason to examine pilots carefully, not a guaranteed business case. Investment decisions should be tied to corrected product information, relevant recommendation and tested incremental choice, rather than a promised uplift borrowed from an opaque pilot summary. [16][18]
Grocery competition is not simply moving from the shelf to the chatbot. This analysis argues that brands need to be persuasive to people, accurately interpretable by assistants and eligible for purchase in a specific commerce environment. The useful question is whether AI recommends the right product for the right need, whether that recommendation survives real constraints, and whether it changes choice relative to a credible control. A proposed human × AI research programme can investigate those links. Current visibility, perception and retail-sales evidence cannot be compressed into proof that AI has taken control of the basket. [18]
This analysis reviews 17 published source documents and their disclosed methods as of 15 November 2026. Reading a source establishes what its publisher reports; it is not empirical reproduction of the underlying respondent, retail-measurement, recommendation, pilot-revenue or transaction data. Survey-reported influence, task use, willingness and perceived benefits, benchmarked mentions, market outcomes and platform announcements are not statistically pooled. Relevant populations, periods, geography and limits are stated beside claims. Restricted EMARKETER charts were not independently recounted, and its decimal and whole-percentage presentations remain unreconciled. Unverified precise McKinsey purchase-chart values are omitted. Checkout, stock accuracy and later rollout completion were not hands-on tested. The five-system prompt baseline, country-specific human samples, randomised controls, machine-brand-equity concept, KPI definitions and Dig One CPG AI Choice Index are proposed and unexecuted. They are not claims of existing product capabilities, guaranteed precision or validated sales forecasts. Reference 18 identifies this article as the source of editorial proposals and interpretations, not independent empirical evidence.
[1] AI Is Resetting the Rules of Growth in CPG
[3] AI Visibility Index: US Food and Beverage Leaderboard, July 2026
[5] 2026 Private Label Report: $282.8 Billion in Sales
[6] Agentic commerce for consumer products – Competing on the algorithmic shelf
[8] Instacart Brings Its AI-Powered Shopping Technology to Grocers’ Own Websites and Apps
[9] Walmart Partners with OpenAI to Create AI-First Shopping Experiences
[10] How Retailers Can Reinvent the Digital Flywheel for Agentic Commerce
[11] Who wins when AI does the shopping? New evidence on agentic commerce
[12] AI can shop for you. But will consumers let it?
[13] Caddle x RCC: Growing AI Influence in Shopping
[14] Assessing progress on the Competition Bureau’s retail grocery recommendations
[15] Finding Harmony on the Shelf – Canada’s Turn to Lead
[16] Are CPG Companies Ready for Agentic Commerce?
[17] Powering Product Discovery in ChatGPT
[18] AI is rewriting the grocery shortlist, not replacing the shopper
This article links directly to the primary documentation, paper, filing or original reporting used for its material claims.