Primary sources cited
This article links directly to the primary documentation, paper, filing or original reporting used for its material claims.
AI visibility shows what appears in monitored answers. Brands also need to know whether they are recommended for the right reasons—and what consumers…
AI visibility is a useful diagnostic. It is not, by itself, evidence of preference, purchase or market share.
Author: Ian Ash
Published: November 13, 2026
Category: Analysis

A brand can gain a larger share of AI mentions without gaining a larger share of customers. That does not make visibility metrics useless. It means that appearing in an answer, being recommended as a suitable choice and persuading a person are different outcomes. New industry commentary is sharpening this distinction, while the Interactive Advertising Bureau’s measurement framework offers a more precise vocabulary. The next step is to connect what machines say with what people actually encounter, consider and do—not to treat one as proof of the other. [1] [2] [3]
AI visibility platforms monitor selected prompts across systems such as ChatGPT, Gemini, Claude and Perplexity. They can record brand mentions, citations, competitive appearances and changes by engine or over time. These observations help reveal an information environment that website traffic alone cannot fully describe: a customer may encounter product advice without visiting the brand’s own pages.
The measurement universe still matters. Prompt wording and selection, geography, engine mix, competitors, repeated runs and counting rules determine what the score represents. A hypothetical 35% AI share of voice is not evidence of 35% of all consumer conversations about the category. It describes a share within a specified observation system.
For this article, visibility means how often a brand appears in tracked answers, while share of voice means its relative mention share within a defined competitive category. Both are useful diagnostics. Neither directly measures human exposure, preference or market share. [1]
The terminology is not yet consistent. IAB defines share of voice as brand mentions divided by all brand mentions within a defined competitive category. Its separate Mention Rate divides answers containing a brand mention by all tracked answers. A measure based on answers and a measure based on mentions can change for different reasons—for example, when an answer starts listing more brands. [1]
A November 13 Search Engine Land analysis by Gaetano DiNardi, drawing on Alisa Scharf’s Seer Interactive framework, uses AI share of voice for the proportion of tracked answers naming a brand. That is closer to IAB’s Mention Rate than its relative share-of-voice definition. The same framework measures definitive recommendations against all answers to the tracked buyer questions. These are published practitioner conventions, not interchangeable industry-wide standards. [2] [4]
The practical requirement is to label the numerator, denominator and observation base before comparing scores. A brand’s share of mentions, frequency of recommendations and share of all counted recommendations are separate measures. A dashboard should also explain how it codes multiple brands, qualified endorsements, negative mentions and different customer needs.
Imagine a mortgage shopper asking which Canadian lender suits a self-employed borrower who values prepayment flexibility and might move within three years. An illustrative answer could mention six lenders, cite one as an information source, describe two as poor fits and explicitly recommend only one or two. Counting mentions would not distinguish those roles.
Recommendation measurement should identify which lenders are presented as suitable choices and why. Positioning assessment should ask whether those reasons match the intended customer, whether the important product claims are correct and how prominently the recommendation appears. The objective is not to manufacture a favourable description of an unsuitable offer; it is to understand whether legitimate advantages are accurately represented.
This is not only a theoretical distinction. In a five-brand dental-software audit published by Emma Baker on November 5, frequent inclusion did not guarantee faithful customer positioning. Its approximately 2,000 scoring units were brand mentions, not consumers or independent answers, and fidelity was assessed against vendor positioning rather than independently demonstrated product suitability. The audit did not measure customer losses or test whether its proposed fixes worked. [5]
IAB published Measuring Visibility in the AI Era on August 3, 2026. Presence asks whether a brand appears or a publisher is cited. Prominence asks where and how conspicuously it appears. Portrayal examines context, framing and accuracy. Persuasion asks whether visibility drives action. IAB said at the launch that more than 20 companies sold AI visibility measurement tools whose different methods could produce different answers for the same brand; that was an attributed industry statement, not a November vendor census. [1]
The framework does not treat every persuasion measure as a machine-output score. Recommendation Strength evaluates active endorsement rather than passive inclusion. Post-Citation Click-Through Rate can examine user traffic where suitable platform and click data are available. A referral visit count alone does not supply the mention or citation denominator needed for that rate. [1]
This is a meaningful advance in measurement discipline, but it is not a completed consumer-choice or sales-attribution system. IAB explicitly reserves full attribution methodology for separate work. Recommendation strength is not the percentage of people persuaded; a click is not evidence that a customer believed the claim, preferred the offer or purchased it. [1]
Similarweb’s observational U.S.-desktop panel study offers evidence beyond answer counts. Across qualifying ChatGPT recommendation journeys collected from July to December 2025, users were, on average, 2.5 times as likely to visit the recommended brand’s website as its direct competitor’s within seven days. The comparison involved finance, travel and beauty brand pairs—not all brands or all AI users. Search Engine Land reported the finding on June 24, 2026; the underlying report’s visible publication date was not disclosed. [6] [7]
The study excluded prompts naming the brand and users with a recorded visit to its domain during the previous four weeks. That does not establish complete prior unfamiliarity, exclude visits on other devices or remove all pre-existing purchase intent. The public report describes thousands of journeys but does not disclose the exact cohort counts, averaging weights or headline calculation formula. Respondent-level browsing data and analysis code were not available for this review. [6]
The result is a comparison of subsequent visit probabilities, not 2.5 times more purchases, a randomised exposed-versus-unexposed test or a causal acquisition estimate. Most recommendation-exposed users in the displayed cohorts did not visit the recommended brand within the window. The finding supports investigating recommendations and later behaviour separately; it does not validate AI share of voice as a proxy for sales or market share. [6]
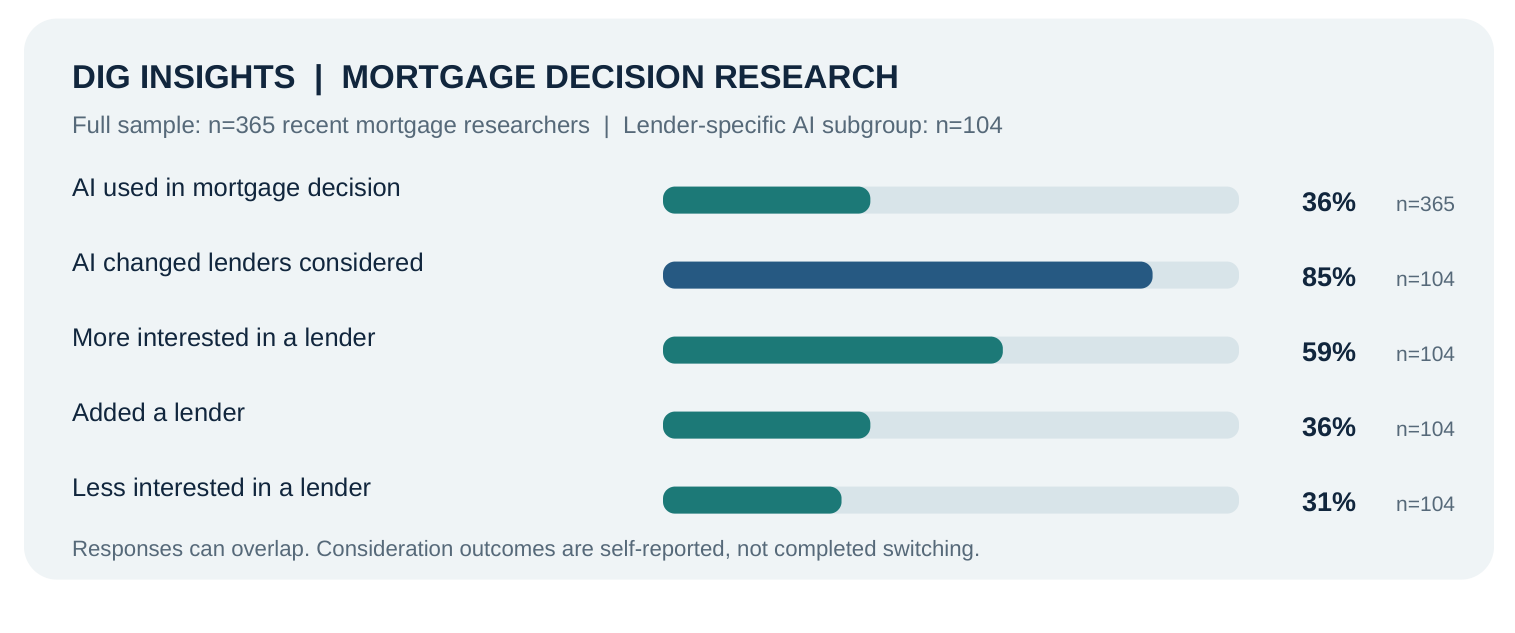
The October 2026 Dig Insights System 0 Mortgage Study examines something AI answer tracking cannot independently observe: reported changes to a borrower’s shortlist. Among 365 respondents who had looked for a mortgage in the previous 18 months, 36% reported using an AI tool for their decision, including chat assistants and AI-generated search summaries. Those channels could overlap. Only 6% of the full sample reported asking AI to compare lenders. The study therefore distinguishes using AI somewhere in the decision from delegating the comparison itself. [8]
Among 104 AI users whose AI information involved specific lenders, 85% reported a change in the lenders they considered. Within that subgroup, 59% became more interested in a lender, 36% added one and 31% became less interested in one. These multiple-response answers overlap. The source also reports approximately 24% of the full 365-person sample experienced a consideration change; that is not the proportion who switched lenders or a measured causal effect on their eventual choice. [8]
The findings are self-reported and specific to recent mortgage researchers, not a representative estimate of every Canadian consumer. The supplied source does not disclose the full sampling or weighting method, and respondent-level records were not available for this review. Its lender-specific rebase also assumes the exclusion answers were exclusive. The useful contribution is direct questioning about consideration that machine-output tools cannot supply. AEO Updates’ earlier banking analysis sets out the study’s bases and context. [8]
An Envoyra software benchmark, reported by Search Engine Land on October 22, produced 2,720 answers from 170 questions across four requested API models and four weekly runs from September 13 to October 4, 2026. The assistants shared the most-frequently named tracked brand in only one of five software categories. This was a vendor-selected output sample—not a study of consumer choices or today’s consumer-facing applications. [9] [11]
The limitations matter. Later November method notes disclose substantial response truncation, a different brand-matcher version in the final week and unrecorded sampling settings. Their effects were not measured, so the observed changes cannot be cleanly attributed to model behaviour alone. Dan Taylor’s June 8 commentary similarly proposes separating mentions, explicit recommendations and qualitative narrative, but supplies no standardised formulas or tested sales relationship. [10] [12]
A single AI ranking should therefore not be treated as a complete or permanently stable competitive position. Prompt selection, repeat-run variation, new source information and changes to the model can offer competing explanations for movement. Consistency and accuracy for the customer needs where a brand should credibly compete are more useful questions than a context-free league table. IAB’s framework calls for repeated observations, platform disclosure and attention to uncertainty. [1]
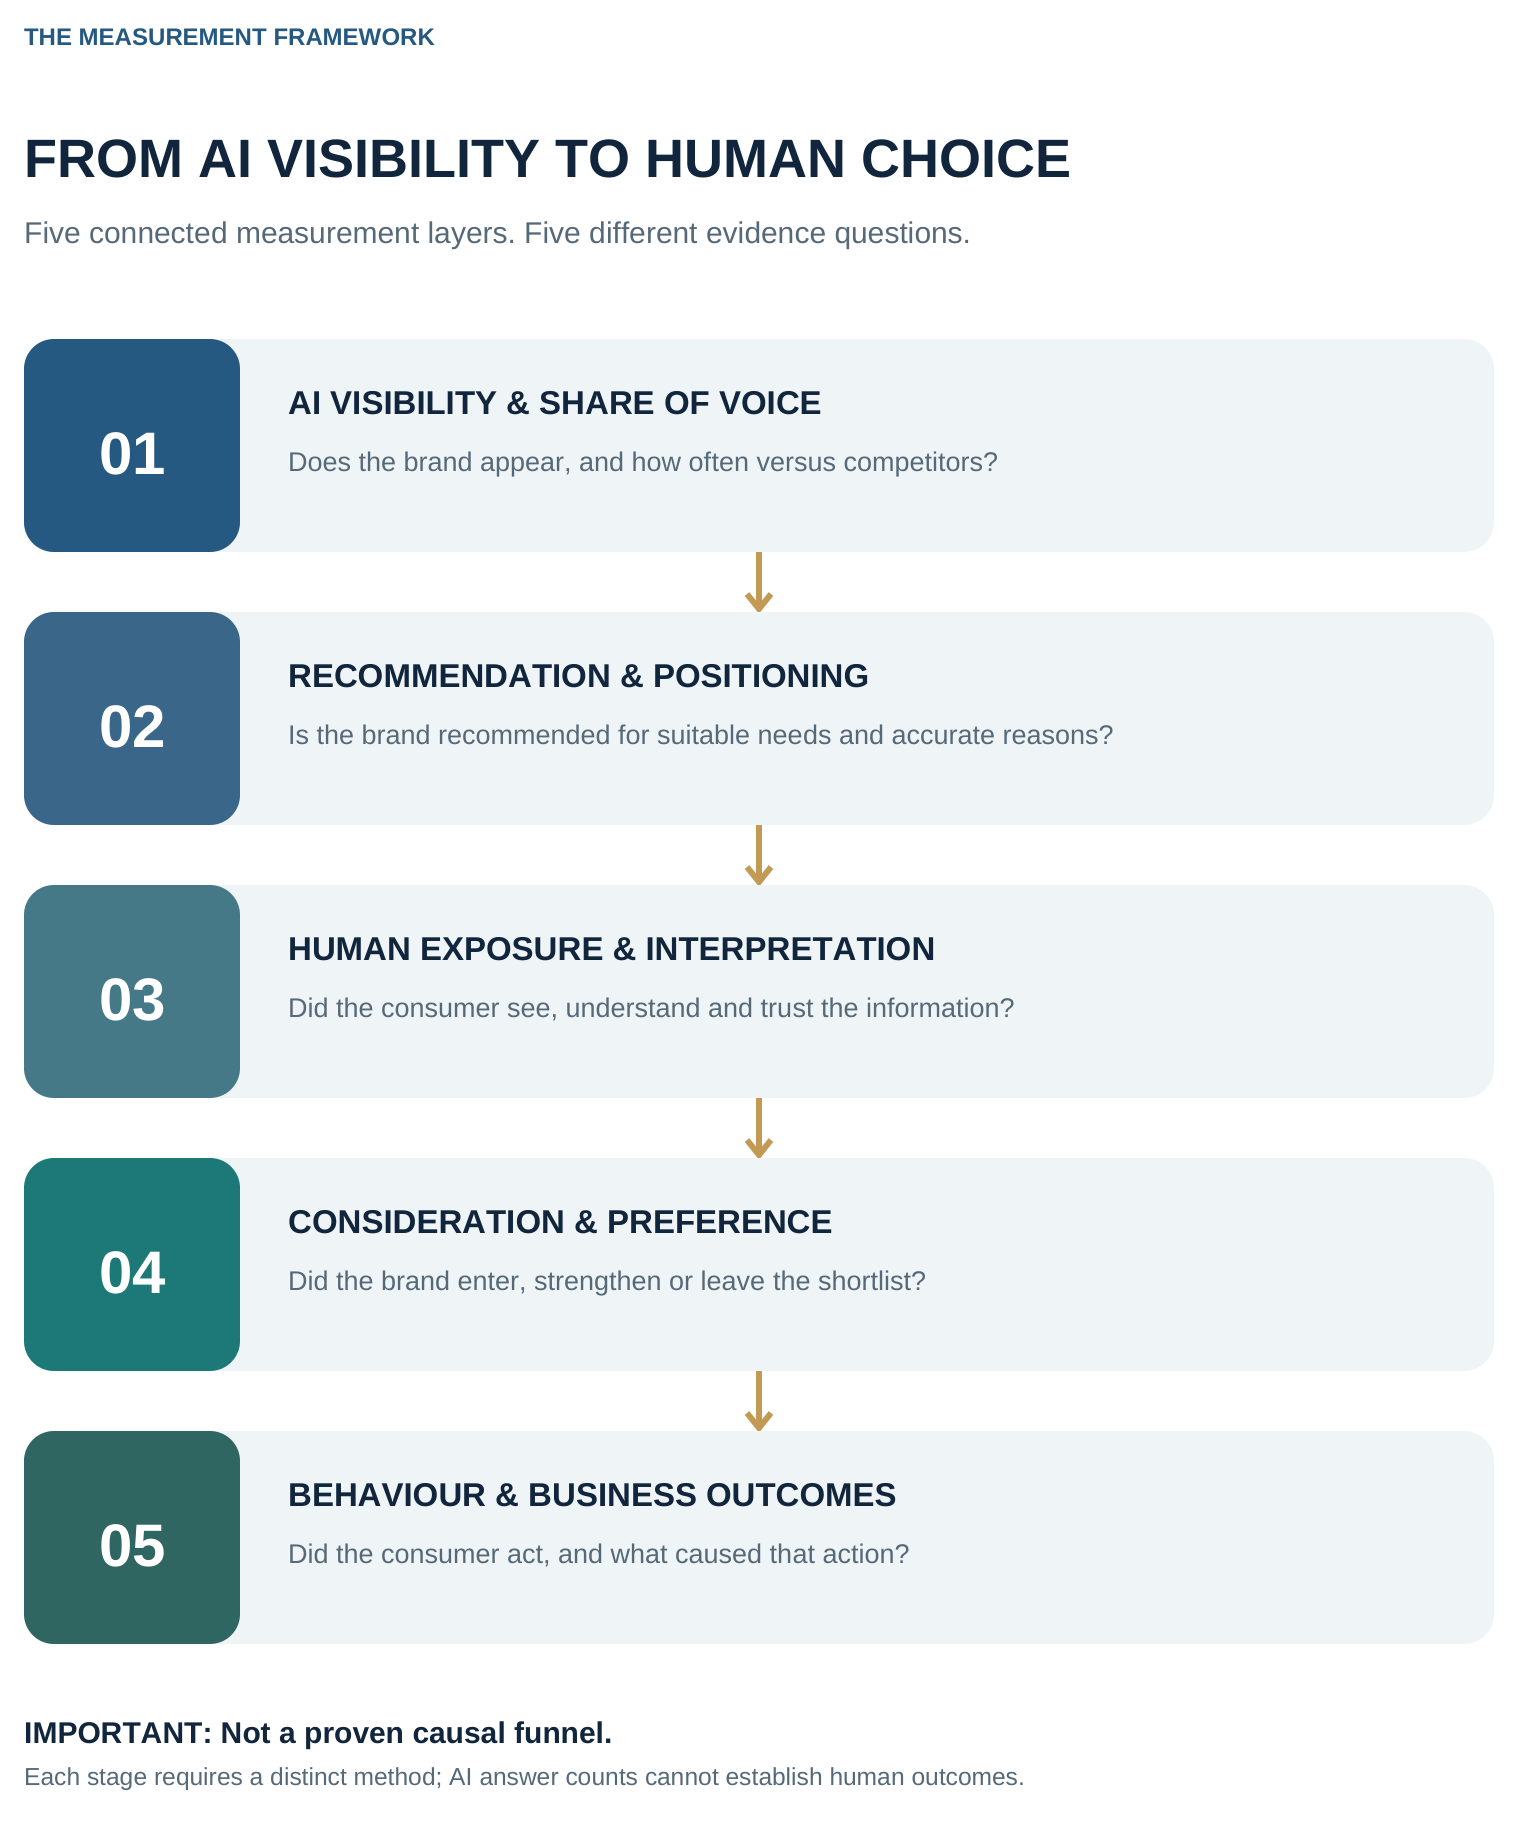
The supplied framework organises five complementary questions. Visibility and share of voice describe appearances in a selected answer universe. Recommendation and positioning describe the role assigned to the brand. Human exposure and interpretation examine what people saw, understood and believed. Consideration and preference examine the shortlist. Behaviour and business outcomes examine subsequent action—and, with an appropriate research design, what caused it.
These are not measured stages of one causal funnel. Different studies using different people, prompts, platforms and dates cannot be joined into transition rates. Ongoing AI tracking and recurring human surveys can reveal changes in representation and reported experience; stronger attribution claims need controlled exposure tests or other credible comparisons capable of separating AI’s contribution from competing explanations.
The layers also identify different remedies. If AI misstates mortgage conditions, the bank may need clearer authoritative information. If AI accurately exposes a weaker offer, content cannot fix the product. If the brand is recommended for reasons customers do not value, positioning or relevance may be the problem. Search specialists, brand and product teams, and market researchers each contribute something different. AEO Updates’ strategy-and-insights analysis explains why human and AI measurement belong together.
AI visibility is a useful diagnostic. It is not, by itself, evidence of preference, purchase or market share. Brands should monitor appearance, recommendation quality and claim accuracy, then investigate what relevant customers encounter, consider and do. An observed purchase still does not automatically establish how much credit AI deserves.
The challenge is to connect credible AI recommendations with human consideration and choice without pretending that mention counts have already made that connection. The companion Gemini 4 Hydrogen analysis explains why a changing search environment makes those distinctions more important, not less.
Sources reviewed 13 November 2026. IAB supplies a measurement framework; contributor commentary supplies proposed conventions, not universal standards. The Similarweb report and Dig findings are separate observational or self-reported evidence with different populations and periods; their underlying user/respondent records were not available and no analyses were replicated. The supplied mortgage example, 35% share-of-voice illustration and five-layer framework are editorial, not an executed experiment or a statistically linked causal funnel. Source approval confirms faithful extraction, not empirical reproduction.
[1] Measuring Visibility in the AI Era
[2] Your SEO share of voice doesn’t tell you if AI recommends your brand
[3] Are we chasing AI visibility at the expense of business results?
[4] Measuring AI Search: The KPIs we actually trust
[5] AI knows what your brand does, but not who it’s for
[6] The Downstream Impact of AI Visibility
[7] ChatGPT recommendations drive more brand website visits: Study
[9] AI brand recommendations vary by platform and week: Study
[10] The problem with AI share of voice and 3 metrics that matter more
This article links directly to the primary documentation, paper, filing or original reporting used for its material claims.