Primary sources cited
This article links directly to the primary documentation, paper, filing or original reporting used for its material claims.
U.S. research links AI use to reported policy changes and purchases, while citation audits show that familiar insurers do not control every answer.
For insurers, the competitive question is not simply whether AI names the brand. It is whether the policy remains a defensible choice.
Author: Ian Ash
Published: November 14, 2026
Category: Analysis
An insurance renewal used to compete mainly with inertia. Comparing exclusions, deductibles and personalised prices takes effort, so an existing policy can survive even when a customer suspects there is a better option. AI assistants offer another way to investigate that choice. New U.S. survey evidence places AI inside reported policy changes and purchases, while insurance citation audits show that well-known carriers are not automatically the sources supplying the answer.
The competitive hypothesis is not that AI inevitably tells customers to switch. A comparison can support staying, changing coverage, asking a broker or shopping elsewhere. The important question is whether insurers can explain why their coverage remains suitable when a policyholder seeks a second opinion. That extends the renewal challenge examined in the telecom loyalty analysis, but insurance brings more consequential differences in protection and eligibility. [13]
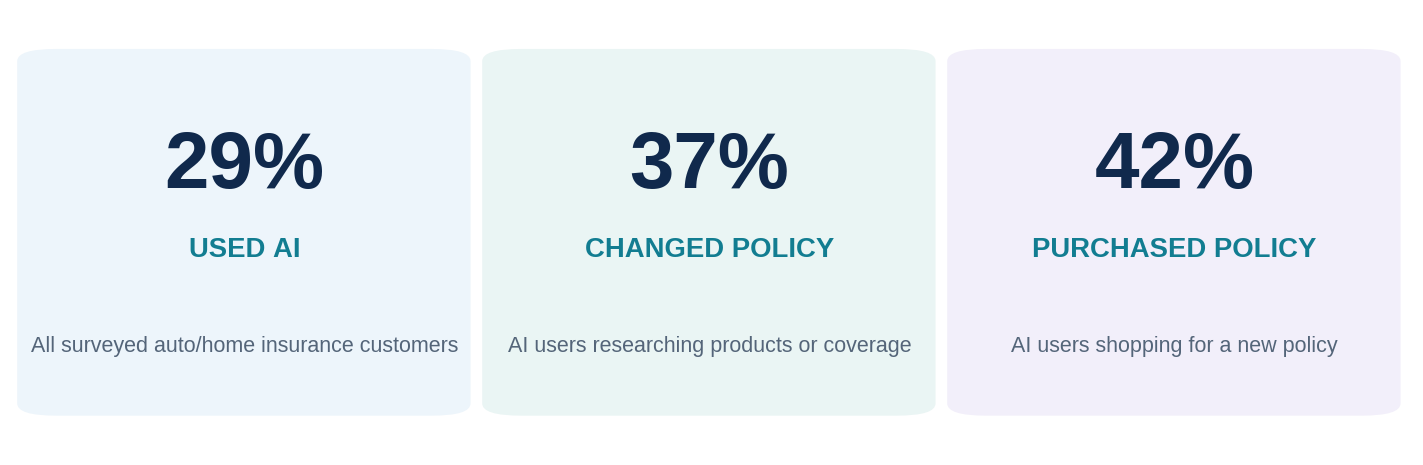
J.D. Power announced its inaugural U.S. AI Insurance Experience Study on August 27, 2026. Fieldwork ran from June through July, producing 8,352 customer evaluations across 24 insurance brands and eight third-party AI tools. Evaluations should not be treated as a verified count of unique respondents. The release reported that 29% of auto and home insurance customers had used AI for activities including research, account servicing, coverage questions or shopping for a quote or policy. This includes insurer-owned tools, aggregators and third-party services, not independent generative AI search alone. [1]
Among customers who used AI to research products or coverage, 37% reported changing their policy based on the information. The detailed release finding says 42% of customers who used AI to shop for a new policy purchased one as a result. Its summary bullet describes the 42% base differently; a November 5 J.D. Power webinar account clarifies the result as customers who used AI while quoting crediting it as a reason they bought. The shopping or quoting interpretation is therefore used here. [1] [9]
These are different subgroups, and their counts are not disclosed in the public material. A policy change is not necessarily an insurer switch. Customer attribution is not independently validated transaction evidence or an estimate of additional sales caused by AI. The three percentages cannot be multiplied into an overall purchase rate or read as a conversion funnel. [1] [9]
J.D. Power's June 9, 2026 Auto Insurance Study release also reports that auto insurance shoppers who used AI were more than 1.3 times as likely to switch insurers as nonusers. The release attributes its AI findings to separate January 2026 AI and Insurance Special Report data. The Auto Insurance Study's 52,216-customer sample and April 2025 to April 2026 fieldwork should not be borrowed as the denominator or timing of that AI comparison. [2]
The association is commercially important, but it does not prove that AI caused switching. Customers already inclined to compare policies may be more likely both to use AI and to move. The public release does not provide the AI-user and non-user bases, their underlying switching rates or a causal design. The defensible conclusion is that AI is present in a consequential shopping journey, not that a measured industry-wide AI churn effect has been established. [2]
Conductor's insurance benchmark was published on August 12, 2026 and updated the following day. Its U.S. answer-engine analysis covers January 1 to May 31, with more than 3.6 million citations to domains classified as Insurance and more than 178,000 distinct prompts across seven engines. Industry classification follows the cited domain, so these are not necessarily 178,000 insurance questions. The analysis uses 445 Insurance domains. [3]
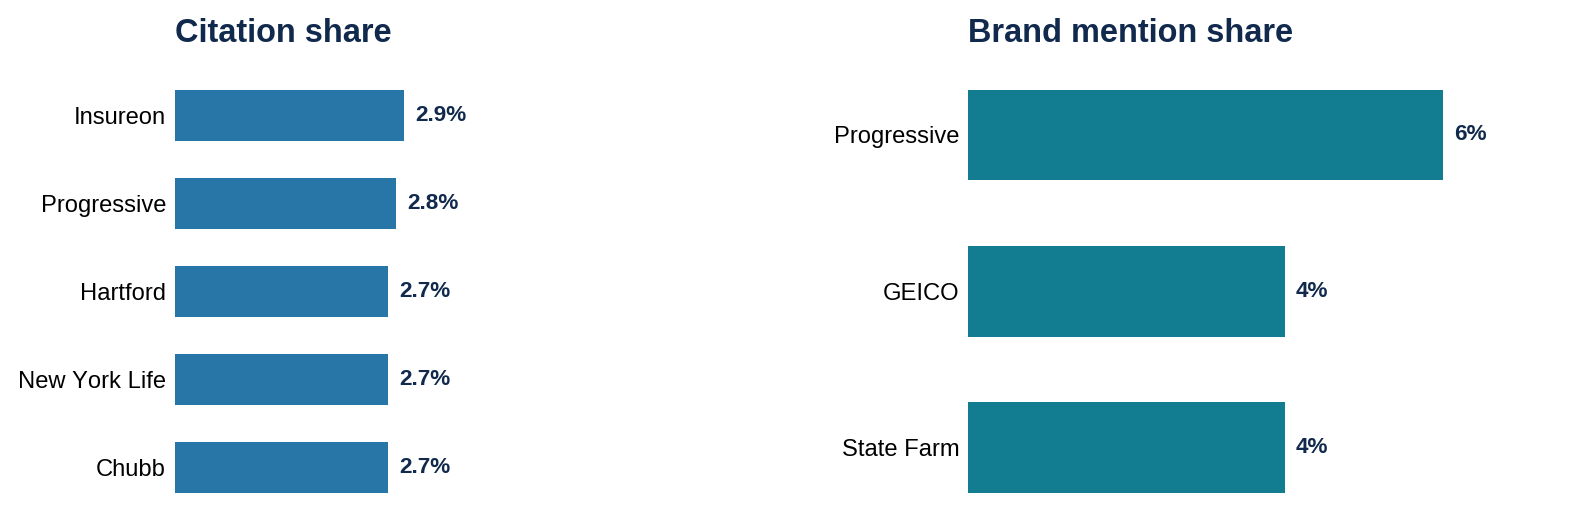
Within that citation universe, Insureon accounted for 2.9%, Progressive 2.8%, and The Hartford, New York Life and Chubb 2.7% each. A separate mention measure placed Progressive at 6%, with GEICO and State Farm at 4% each. Their citation shares were 1.7% and 1.2%. The public report does not disclose a complete mention-counting formula, so these mention shares should not be described as percentages of answers, recommendations or customers. [3]
An insurer can be familiar enough to be named while another carrier, publisher or marketplace supplies the linked evidence. A source can also be cited without being recommended to buy. Brand recognition, citation presence and recommendation suitability are different questions, not interchangeable measures of market share. Conductor itself distinguishes its volume baseline from whether an AI system recommends a brand. [3]
In Conductor's January to May Brokers/Aggregators citation subset, Insureon held 13.2%, The Zebra 7.5%, Insurify 7.2% and Policygenius 5.9%. A separate Google AI Overviews analysis covers May 20 to June 20, 2026, not the same period. Within its broker-subset citations, Policygenius held 13.5%, The Zebra 10.4% and Insurify 7.9%. These are shares of citations within each specified subset, not the shares of all insurance citations or completed sales. [3]
There is also a product route into conversational comparison. EMARKETER documented Experian and Insurify's branded auto insurance apps in ChatGPT in February 2026. Experian's February 12 announcement described estimated rates and coverage questions, with personalised quoting on its website. Insurify later documented an upgrade to real-time personalised quotes for eligible shoppers. Its upgrade page carries an August 13 update label and describes state-limited availability; this article has not independently tested November rollout. Final purchase still requires an external handoff. [5] [10] [12]
A connected app is not an ordinary independent ChatGPT answer, and a quote is not a bound policy. Nevertheless, these services create a plausible competitive position between a customer's question and a carrier's offer. An insurer may still underwrite the policy while an intermediary supplies the explanation, comparison or referral. Whether that changes customer choice needs evidence, but monitoring only competing carrier names can miss this part of the journey.
EMARKETER's August 7, 2026 AI Visibility Index article reports 5,600 measured ChatGPT recommendations across nine financial-services categories in Q2. It uses standardised prompts in U.S.-based interactions, not a representative sample of every consumer conversation. In June, State Farm and USAA ranked first and second for insurance, with mention rates of 50% and 32%. Those rates fell six and ten percentage points respectively from April to June. Exact insurance-category counts and the complete collection design were not available in the public material. [4]
The first-position denominator matters. State Farm's 45% No. 1 mention rate means it was mentioned first in 45% of insurance recommendations that mentioned State Farm, not 45% of all measured insurance recommendations. For renters insurance, it appeared in 73% of measured recommendations and was first in 58% of recommendations that mentioned it. These are conditional positions and appearances, not customer preference or policy market share. [4]
An insurer can perform differently in renters, auto and home prompts. Tracking should therefore define the product, customer situation, jurisdiction and competitor universe. AI visibility records whether the brand appears; share of voice records relative mentions; recommendation rate records active recommendations within the chosen prompt base; recommendation share records a brand's portion of recommendations within a defined competitor set. Provider definitions must be checked before comparing any of these results.
Insurance comparison is unusually sensitive to what an answer leaves out. Auto policies can differ in deductibles, liability limits, accident benefits and exclusions. Home protection can differ on water damage, sewer backup, overland flooding, replacement cost and valuables. A generic answer may explain broad product differences without knowing the household's risk profile or the terms that determine eligibility and a personalised quote.
For insurers, the competitive question is not simply whether AI names the brand. It is whether the policy remains a defensible choice. Public information should make coverage conditions, exclusions, eligibility and quote requirements understandable without implying that a summary replaces policy wording or licensed advice. Clear content cannot make an unsuitable or uncompetitive product the right recommendation.
FSRA's table gives an average annual private-passenger premium of C$2,218 for Ontario as of June 2026, compared with C$2,120 as of June 2025. GTA averages were C$2,868 and C$2,765; Other Urban averages were C$2,131 and C$2,031; Rural averages were C$1,791 and C$1,698. These are trailing-12-month averages for insured private passenger vehicles, not June-only premiums, like-for-like renewal increases or individual quotes. [6]
Ontario's statutory accident-benefits rules changed effective July 1, 2026. Standard medical, rehabilitation and attendant care benefits remain mandatory; other accident benefits are optional. Existing policies renew with the same coverage and limits unless the customer agrees with the insurer in writing to decline benefits or change them. Optional status therefore does not mean that existing customers automatically lose those benefits at renewal. [7] [11]
Who is covered by newly optional benefits changed on July 1 regardless of renewal date. FSRA's fact sheet identifies the named insured, their spouse, dependants of either and specified drivers under the policy. An answer comparing prices needs to consider selected benefits, limits and covered people, rather than assume a lower premium buys equivalent protection. The article reports these regulatory summaries; it does not recommend adding or removing coverage for an individual. [11]
PolicyMe's report, updated October 28, 2026, describes an online survey of 1,506 adult Canadians who were Angus Reid Forum members. Its detailed methodology gives June 26 to June 30 fieldwork, although its FAQ refers to July. The detailed dates are used with that inconsistency noted. The commercial report does not disclose the question-level bases, full questionnaire or weighting details needed to reconstruct every percentage. [8]
PolicyMe reports that 25% were not confident or were unsure their home or auto insurance would fully cover them after a major loss. It also reports 13% did not really understand their coverage, 16% reduced coverage in response to higher premiums, and 5% cancelled it. These are reported confidence, understanding and coverage decisions. They are not verified policy inadequacy, unique-person totals obtained by adding categories, or evidence of an AI effect. [8]
They nevertheless identify a useful question for insurers: can customers understand the protection they are paying for? In Canada, comparisons need province-specific conditions and actual policy wording. A nationally generic answer can sound plausible while missing a material local or household constraint.
Conductor's citation audit, EMARKETER's prompt-based recommendations and J.D. Power's customer reports offer complementary views. They cannot be collapsed into a single score or statistically pooled. A citation does not establish an endorsement, an endorsement does not establish human exposure or trust, and a reported purchase after AI use does not establish an incremental sale.
Insurers can continuously track relevant renewal, coverage and comparison prompts, then inspect what AI recommends and whether its facts and suitability explanations are accurate. Repeated human surveys can measure exposure, brand associations, coverage understanding, trust and consideration. Quotes, policy changes, renewal and switching outcomes should be analysed separately, with attribution-capable designs before claiming incremental impact.
The recommended strategic approach is to join approved policy evidence, human choice research and AI visibility diagnostics, as described in the Dig Insights and System 0 strategy article. Equip brokers and advisers to handle AI-informed questions, and identify which customer needs the insurer genuinely wants to serve. This is an editorial recommendation for complementary measurement, not independent proof of vendor superiority. [14]
Conversational comparison could reduce part of the effort involved in investigating alternatives. A policyholder may discover another insurer, ask better broker questions or identify a coverage mismatch. The same process could show that existing protection offers better value after deductibles, exclusions, service and eligibility are considered. Staying, adjusting coverage, shopping and doing nothing all remain possible outcomes.
The evidence does not yet quantify an industry-wide causal effect of AI on insurance churn. The more defensible hypothesis is that AI can make the underlying offer easier to investigate. Which insurers benefit will depend on product fit, trustworthy evidence, recommendation quality and the customer's response, not visibility alone.
Insurance now provides meaningful evidence of AI involvement in consequential customer decisions, including self-reported policy changes and purchases. It also shows why recognition, citations, recommendation positions and choice need separate measures. For Canadian insurers, coverage complexity and changing benefit rules make a correct, appropriately qualified answer as important as a prominent one.
The practical priority is to explain which protection is real, which customers it suits and why the offer remains competitive, then test what AI and people understand. The renewal question is no longer only whether the customer can find a lower price. It is whether a credible second opinion gives them a reason to stay.
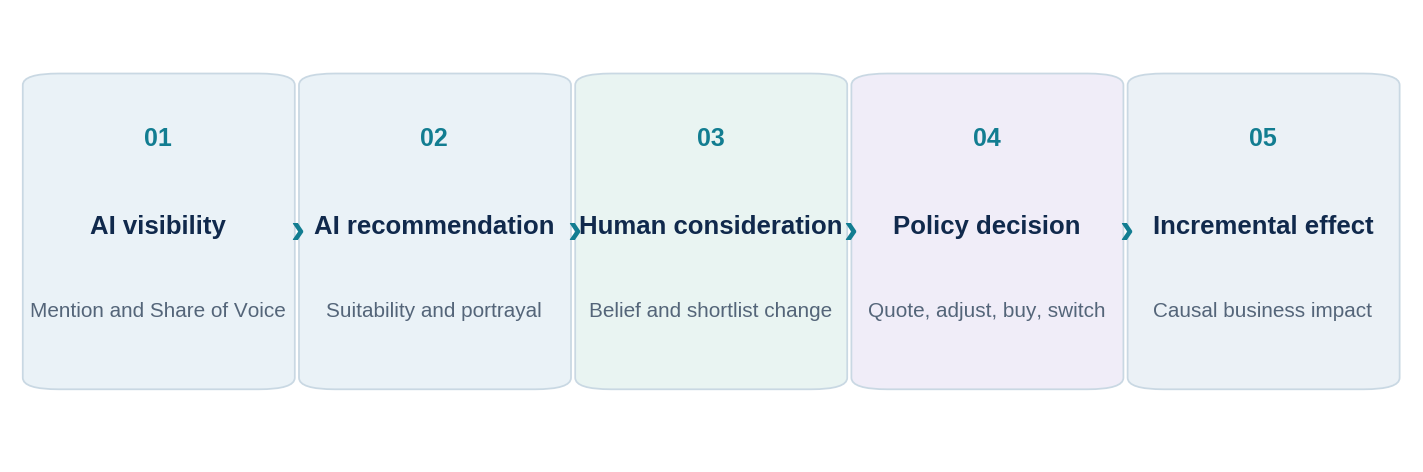
This article synthesises published U.S. surveys, vendor-defined AI-response and citation audits, Canadian consumer research and Ontario regulatory guidance. Their populations, periods, platforms and denominators differ and are not statistically pooled. Source review confirms faithful extraction, not empirical reproduction of underlying data or independently validated transactions. J.D. Power subgroup counts and the exact January switching-study bases are undisclosed; EMARKETER subscriber-only charts and complete datasets were not accessed. Known source wording/date inconsistencies are identified beside the affected claims. Insurance comparisons and the five-layer framework are editorial interpretations, not personal advice or a validated causal funnel.
[1] AI Begins to Wield Significant Influence on Consumers’ Auto and Home Insurance Decisions
[2] Auto Insurers Struggle to Maintain Seamless Interactions Across Channels, JD Power Finds
[3] 2026 AI Search & AI Overview Benchmarks: Insurance
[4] AI Visibility Index: Financial Services Leaders and Movers
[5] Insurance shopping moves inside ChatGPT
[7] Optional and extra coverage
[8] Coverage, Confidence, and Cost: Home and Auto Insurance in Canada
[9] The AI Insurance Experience: How Carriers Stack Up on Their AI Capabilities
[10] Real-Time Car Insurance Quotes, Now in ChatGPT
[11] Fact Sheet: 2026 Accident Benefits Reforms: What Ontario drivers need to know
[12] Experian launches Insurance Marketplace app on ChatGPT
[13] The telecom loyalty trap: what happens when AI finds a better deal?
This article links directly to the primary documentation, paper, filing or original reporting used for its material claims.