Primary sources cited
This article links directly to the primary documentation, paper, filing or original reporting used for its material claims.
Restaurant discovery and changing appetites are distinct trends. Source-qualified evidence suggests a testable opportunity for chains to match specific…
A relevant recommendation is not yet an incremental sale.
Author: Ian Ash
Published: November 16, 2026
Category: Analysis
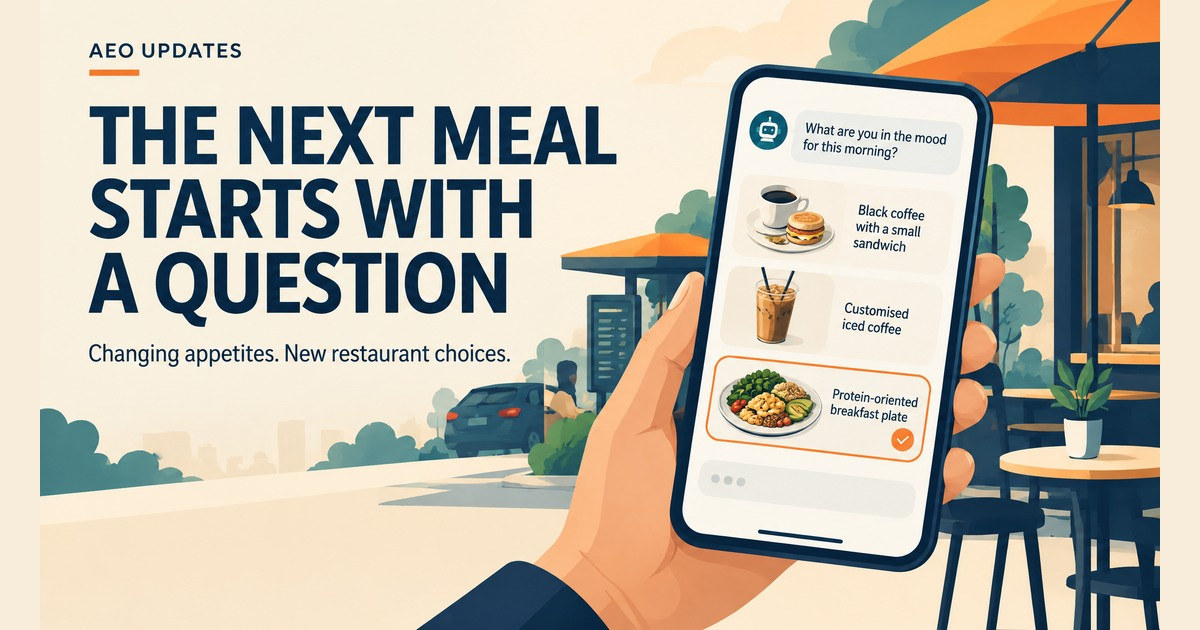
A restaurant recommendation could start with a need rather than a brand: coffee and breakfast within a budget, a smaller lunch, or an iced drink with a specified amount of protein. AI offers a way to match those requests to menus, locations and preferences. Separately, research on GLP-1 medication users reports changes in some restaurant orders, but not a uniform disappearance of restaurant visits. Together, these developments suggest a competitive hypothesis: chains may increasingly need to explain which occasions they serve, not simply make their names visible. The evidence does not establish a joint causal relationship between medication use, AI recommendations and sales. [1][2][4][17]
For Canada, the relevant comparison centres on Tim Hortons, Starbucks and McDonald’s. In the United States, Dunkin’ belongs alongside Starbucks and McDonald’s, with regional challengers included where they are genuine local alternatives. These are proposed competitive maps, not measured AI rankings. The central question is whether an assistant can identify a suitable restaurant and item when someone describes what they want, and whether that answer changes a purchase. Those are separate tests. [17]
The DoorDash and SevenRooms 2026 Restaurant Industry Trends Report found that 22% of U.S. consumers surveyed had used an AI tool such as ChatGPT or Google Gemini to help choose a restaurant. It also reported that 39% of operators surveyed were updating menu information to improve their AI visibility, alongside managing reviews at 34% and improving photo quality at 32%. Dynata conducted the two surveys in March 2026, with 3,001 U.S. consumers and 509 U.S. restaurant operators; the report was announced on May 18. The 22% is an experience measure, not regular use or the proportion of orders placed through AI. The 39% specifically concerns menu information, and does not imply that the remaining operators take no visibility actions. Exact questions, recall windows and item-level bases are not published. [4]
Toast separately reports that 64% of surveyed U.S. guests in its 2025 survey had tried a new restaurant in the past month, against 39% in its 2024 survey, a 25-percentage-point difference. Its page currently displays July 30, 2026, while the explicit 2025 fieldwork dates are October 9–15, 2025. Eligible adults had dined in, ordered takeout or ordered delivery within three months. The page gives conflicting 2025 samples, 1,466 in the introduction and 1,446 in methodology; the precise 2024 baseline methodology remains unverified. This is not a same-person panel or an AI-specific result. It provides context for discovery, not evidence that AI caused the increase. [5]
Circana’s January 14, 2026 release reports stable restaurant-visit frequency during consumers’ first year on GLP-1 medication, together with a 1% decrease in the average number of items ordered per restaurant trip. The item figure is a relative decrease, not one percentage point, fewer trips or reduced calories. Circana provides no numerical estimate for the stable visit-frequency finding or a precise comparison baseline. It says the research combines consumer surveys and receipt tracking, but does not disclose sample sizes, detailed linkage or exact fieldwork dates. January is the publication timing, not a verified study window. [2]
Separately, that release says 35% of all restaurant consumers reported ordering smaller portions in October for health-related reasons. The October year is unspecified, and the population is not GLP-1 users alone. Maintaining visits while adjusting items could change food attachment, product mix or ticket value, but those commercial consequences require their own measurements. A restaurant should distinguish a lost visit from a retained coffee occasion with fewer accompanying items, rather than convert either finding into a forecast of revenue loss. [2][17]
Circana’s November 10, 2026 release reports that 37% of surveyed U.S. households said someone in their household had used GLP-1 medications, while 30% reported a current user. These are household reports, not individual prevalence, and the 37% includes current or past experience without a disclosed bounded recall period. The findings combine 2026 household survey research with purchase data from August 2023 through July 2026. For the spending analysis, an active user was identified through the July 2026 Receipt Panel survey, and purchase records were aligned to treatment start dates. The release does not disclose sample size, weighting or uncertainty intervals. [1]
Households with a current user had a pre-treatment restaurant-spending index of 121, using the average of the 12 months before treatment. The index compares average monthly household spending with never-user households during the same period: 100 means equal spending and 121 means approximately 21% higher spending. It fell 4.3 index points in Year 1, then recovered to within 0.5 index points of baseline in Year 2. Circana does not disclose an exact Year 2 endpoint or whether it was above or below baseline. These households continued to outspend never-user households in both years. The finding concerns recovery in relative spending, not a proven rebound in absolute dollars or visits; observational household comparisons do not establish medication causality. [1]
Léger’s report, published March 3, 2026, surveyed adults through its non-probability LEO online panel on February 6–9: Canada n=1,536 and United States n=1,012. It reports current self-reported prescription GLP-1 use of 8% and 11%, respectively, although not everyone answered that question. The medication scope includes examples prescribed by a medical professional, rather than weight-loss use alone. The restaurant question uses much smaller current-user bases, Canadian n=126 and U.S. n=118, not the full national samples. No fixed-duration recall period is specified for changes since taking a GLP-1. [3]
Among those current users, Canada/U.S. responses were 35%/51% for ordering smaller portions, 34%/53% for choosing lighter or healthier options, and 34%/44% for ordering the same amount but not finishing it or taking it home. The latter category cannot be shortened to taking leftovers home. Skipping appetisers or desserts more often was 31%/40%, sharing meals 19%/30%, and the combined category of no noticeable change or not eating at restaurants 18%/9%. These are respondent shares, not reductions in portions or shares of transactions. The categories overlap, but the exact selection instruction is not disclosed. [3]
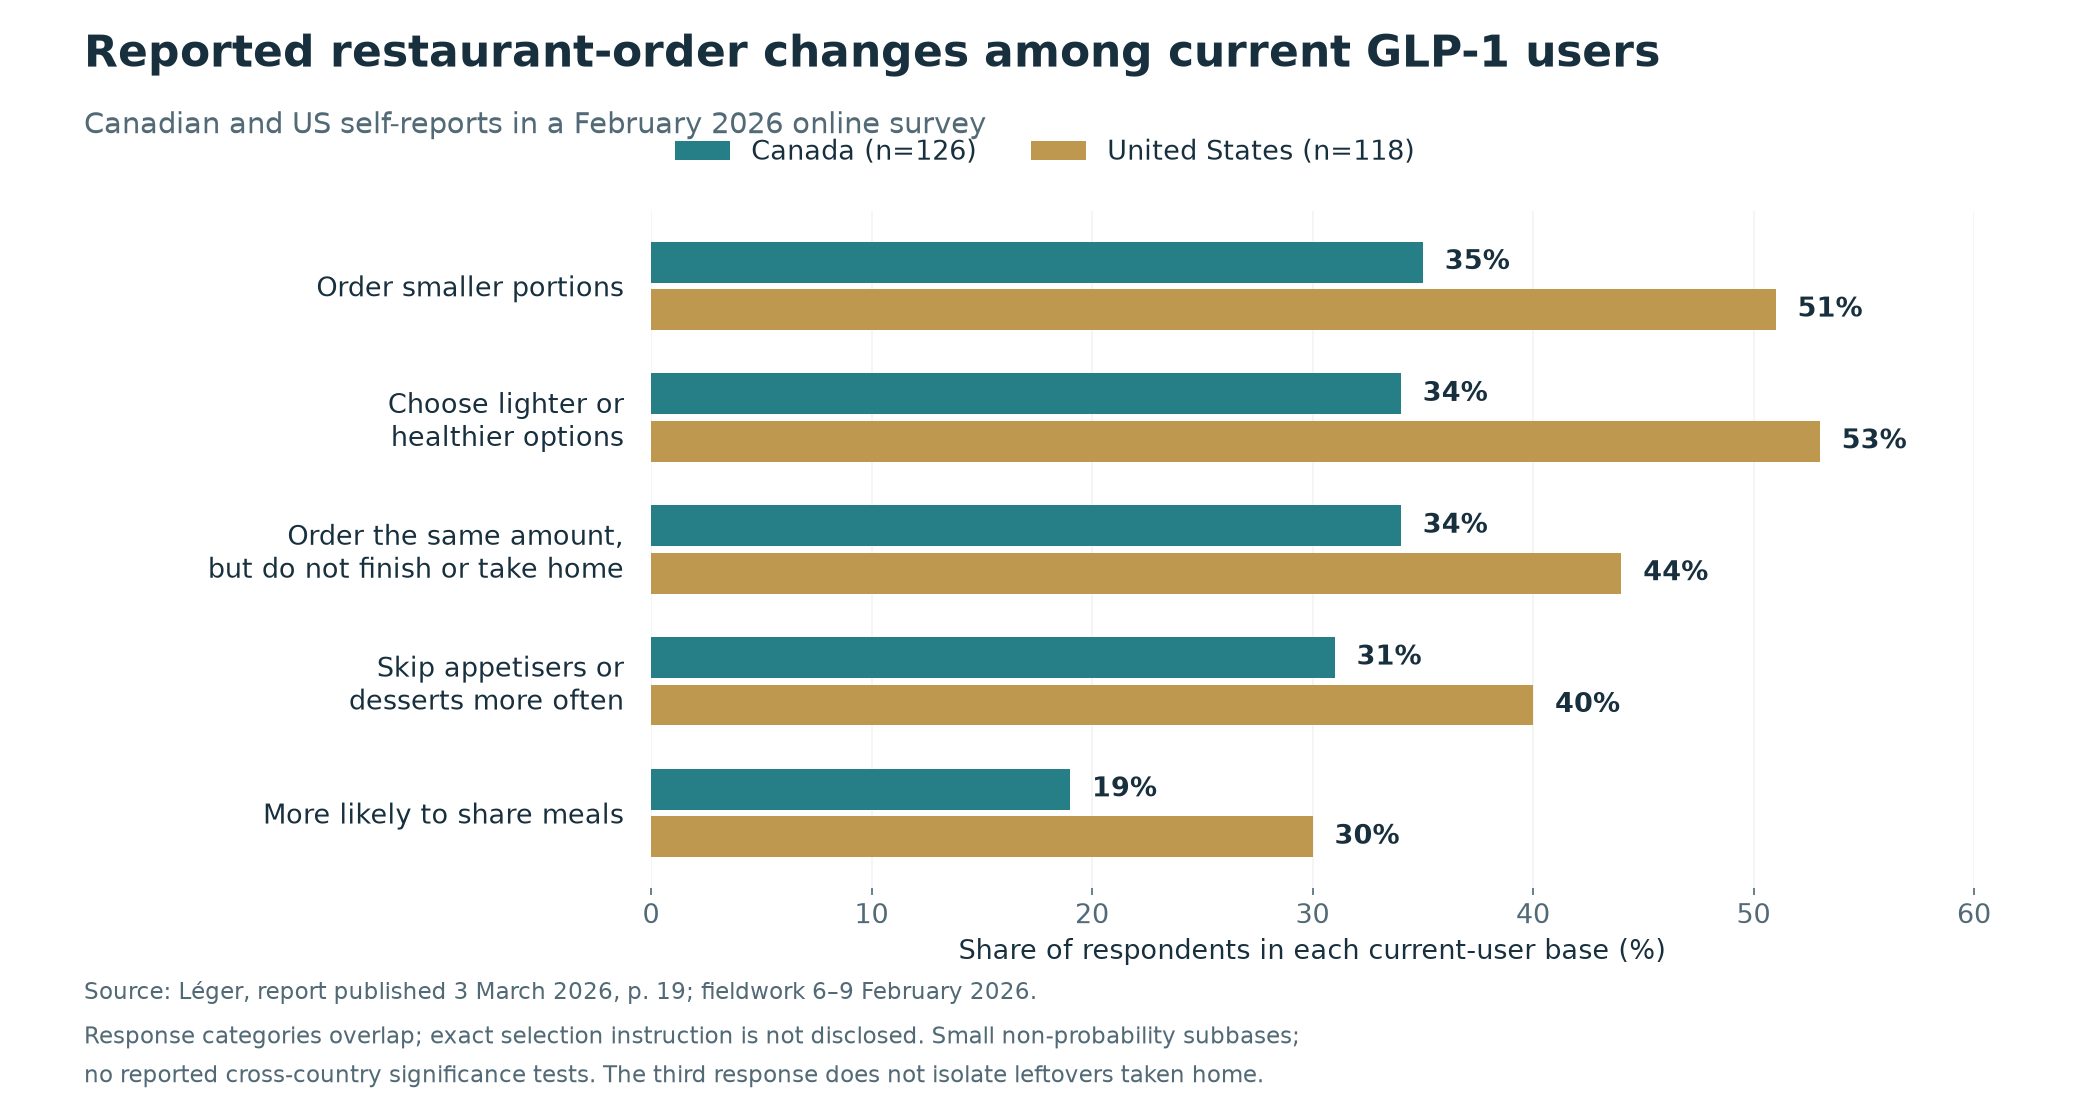
The U.S. response shares are higher for the five reported changes, but small subbases, non-probability recruitment and absent restaurant-level significance tests preclude treating the gaps as established population differences. The no-change category cannot isolate restaurant diners. More broadly, treatment duration, preferences and household circumstances should be investigated rather than assumed uniform. Neither these self-reports nor Circana’s household analysis supports guessing medication use from a smaller order. The practical task is to understand needs with consent, not label customers through their baskets. [1][3][17]
Tim Hortons, Starbucks and McDonald’s should be compared within identical Canadian scenarios. One proposed test would ask for coffee and breakfast under C$10 near a specified commuter route. Another would hold location constant while changing the request to black coffee, a customised iced drink, a smaller breakfast or a fast stop for several people. Tim Hortons’ familiarity and routine, Starbucks’ customisation and McDonald’s coffee-plus-meal proposition are positioning hypotheses to investigate, not demonstrated winners. Current local prices, opening hours and eligible items would determine whether any recommendation actually meets the request. [17]
For Tim Hortons, researchers could compare unaided human first choice with AI recommendations for the same journey and constraints, then examine whether the brand remains eligible as requirements are added. For McDonald’s, the useful test is whether an assistant evaluates the whole coffee-and-breakfast basket rather than excluding the chain because the question appears to concern coffee specialists. For Starbucks, the test is whether its suggested modifications satisfy the stated preferences with accurate nutrition and price. A brand could be preferred by people yet misrepresented by AI, or frequently recommended yet rejected by consumers. Those situations require different responses. [17]
RBI reported that Tim Hortons’ Canadian comparable sales grew 1.8% in the third quarter ended September 30, 2026, against 4.2% growth in the same quarter of 2025. This is a slowdown in positive growth, not falling sales, and the difference is 2.4 percentage points. Starbucks reported North American comparable coffeehouse sales growth of 7.9%, transactions up 2.7% and average ticket up 5.0% in fiscal Q4 2026, its 13-week quarter ended September 27. Its U.S. figures were 7.7%, 2.4% and 5.2%, respectively. The U.S. ticket figure must not be assigned to North America. [10][14]
McDonald’s reported a 0.2% year-over-year decrease in U.S. comparable sales for Q3 ended September 30, 2026, against global growth of 1.5%. Negative U.S. comparable guest counts were largely offset by positive check growth, with neither component quantified in that passage. CEO Chris Kempczinski described improvement as the quarter progressed following an intervention on value; that is management’s assessment, not a quantified late-quarter rebound. Different geographies, fiscal periods and comparable-store definitions make these disclosures unsuitable as a like-for-like Canadian ranking. None establishes an AI-driven sales effect. [10][14][15]
On April 15, 2026, Starbucks announced a beta app inside ChatGPT for beverage discovery using moods, cravings, taste requests or uploaded photos. Its stated flow lets users customise a drink, select a coffeehouse and start an order, with checkout completed in the Starbucks app or on Starbucks.com. This is not purchasing entirely inside ChatGPT or a verified food-ordering service. The announcement does not specify comprehensive launch markets, subscription tiers or client eligibility, and does not establish access to Rewards balances or purchase histories. April’s statement also cannot confirm unchanged functionality or continued beta availability on November 16. [11]
Starbucks’ November 11 roadmap describes a different environment, its own app. The company said a refreshed menu, one-tap food addition, smarter recommendations and same-day scheduling were available. It was exploring conversational discovery and ordering, plus simpler nutrition-aware customisation, for 2027, without firm launch dates. Existing smarter recommendations should not be reclassified as conversational AI. Early-2027 plans included testing background AI assistance for drive-thru baristas, not autonomous ordering replacing staff. Separately explored drive-thru recognition, recommendations and automatic payment were opt-in concepts, not a confirmed chain-wide rollout. [12]
The same November source reports 36 million U.S. Rewards members active in the last 90 days. It gives no precise measurement dates or detailed method, and that count does not demonstrate external assistants’ access to loyalty data. The strategic hypothesis is that relevant discovery could complement preference and routine. Adoption, completed orders and incremental revenue would still need measurement; neither the beta announcement nor the roadmap supplies those outcomes. [11][12][17]
Dunkin’ reported reaching its 10,000th U.S. location in Darien, Illinois, in an October 8, 2025 announcement. That is a company-reported historical milestone, not an exact November 2026 operating count or a worldwide total. On January 7, 2026, it announced Protein Milk in a winter update, including Protein Refreshers and Protein Lattes, with the milk available for beverages permitting a milk or non-dairy base. These historical announcements make Dunkin’ relevant to the U.S. comparison without establishing current promotional availability. [6][7]
Dunkin’ said five named medium builds delivered 15 grams of protein, including Megan’s Mango Protein Refresher, Caramel Chocolate Iced Protein Latte and Iced Protein Latte with Sugar-Free Vanilla. The claim is not universal across sizes or customisations, and Sugar-Free Vanilla describes the syrup, not a verified sugar-free finished latte. The release’s protein footnote is imprecise, referring to grams of “Protein Milk”, while the body explicitly claims grams of protein. Its separate $5 Meal Deal included a Wake-Up Wrap, hash browns and an ordinary medium hot or iced coffee, not a protein beverage. Price and participation could vary, offers were limited-time, and the release supplies no exact end date for the lineup or meal deal. [6]
A useful Dunkin’ test would ask whether an assistant can identify an eligible local drink with at least 15 grams of protein while also respecting budget and sugar constraints. The research should compare the proposed protein drink with the customer’s original choice, distinguishing trial from substitution. Protein interest must not be treated as evidence of medication use. Product attributes can create recommendation eligibility, but no supplied evidence shows that this launch caused AI visibility, acquisition or sales gains. [6][17]
Brandwave’s October 2026 modelled U.S. branded-search shares were Starbucks 43.1%, Dunkin’ 42.0%, Dutch Bros 7.1%, Tim Hortons 3.9%, Caribou Coffee 2.1% and Peet’s Coffee 1.7%. The denominator is six curated brand-term baskets, in English, excluding McDonald’s. It is not the entire coffee market, coffee-drink demand or AI recommendation share. Starbucks and Dunkin’ had displayed shares of 62.9% and 25.8% in November 2025, endpoint changes of minus 19.8 and plus 16.2 percentage points. The rolling page has no verified publication date; November 2025 through October 2026 provides 12 snapshots across 11 monthly intervals, not an October-to-October comparison. [9]
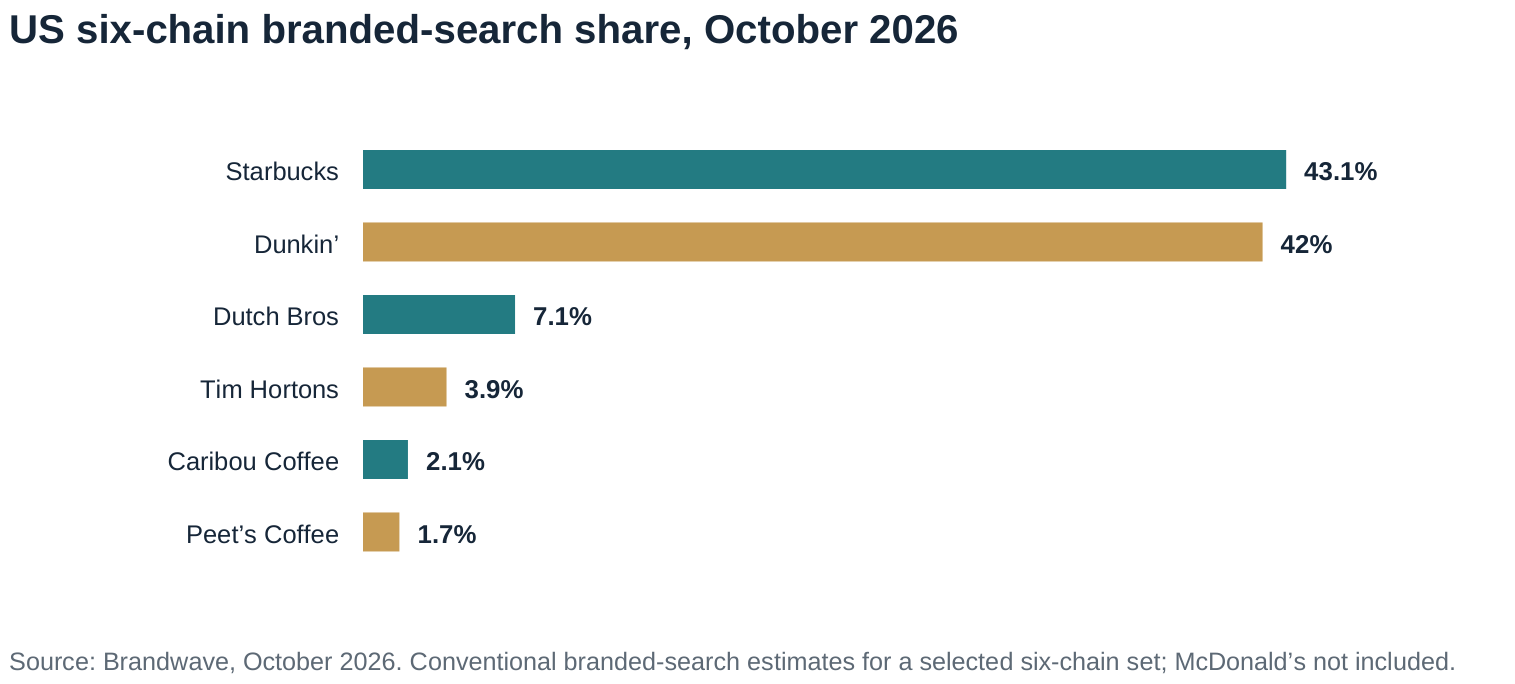
The share gain conceals lower Dunkin’ modelled volume: 12,480,000 to 10,830,000 estimated monthly searches, down approximately 13.2%. Starbucks fell from 30,400,000 to 11,100,000, approximately 63.5%, while the combined set fell approximately 46.7%. Those calculations use published API integers, not abbreviated display figures; underlying estimates are provider-rounded and modelled by an unnamed third party. Brandwave’s separate October 22 AI snapshot contains only three reported ChatGPT answers, not the search-share percentages. Neither measure establishes switching, sales changes or AI causation. [9]
Consumer Edge’s October 29, 2026 analysis reports year-over-year spending-share changes among ages 18–34 during Q3, July–September 2026: approximately plus 3.5 percentage points for 7 Brew, plus 0.3 for Dutch Bros, minus 2.6 for Starbucks and minus 0.9 for Dunkin’. These are credit and debit card spending shares within 12 tracked U.S. coffee-chain brands, compared with Q3 2025. They are not total market shares, coffee-product-only spending or a survey of AI use. Article-specific sample size, weighting and uncertainty estimates are not disclosed. [8]
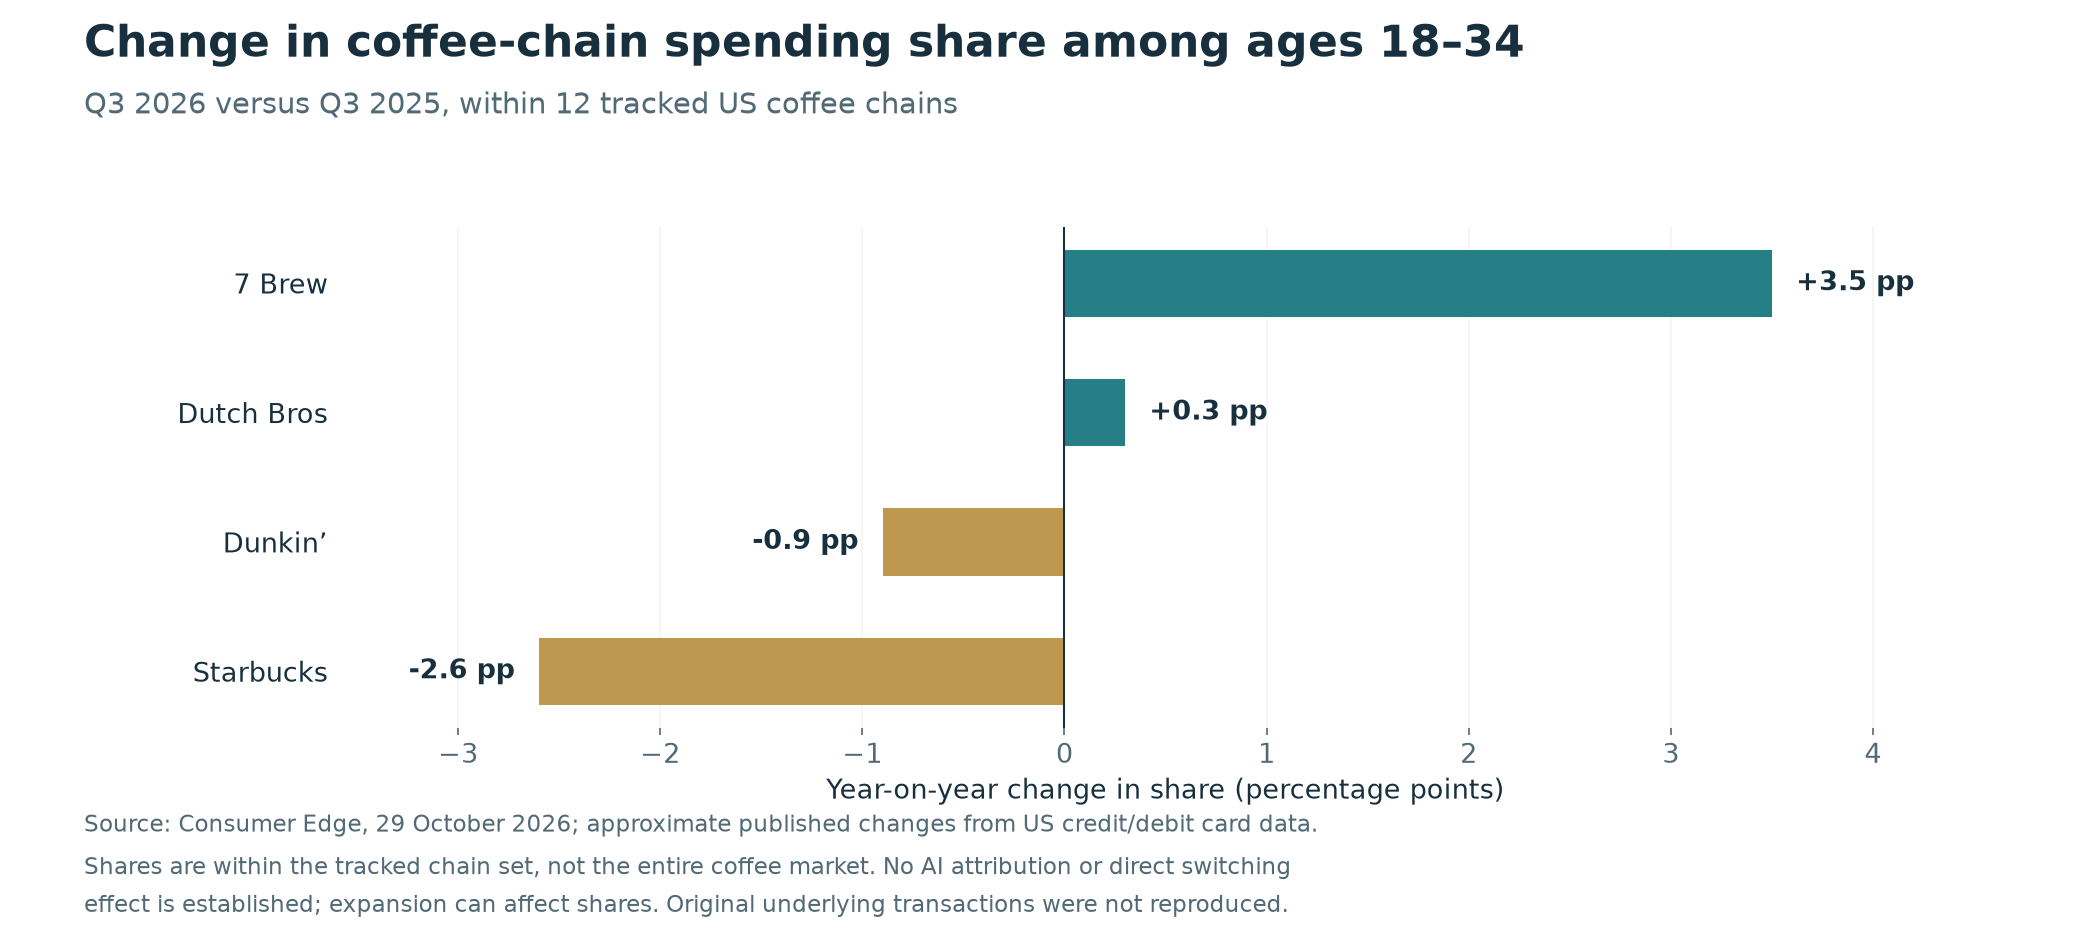
These shifts can coexist with positive Starbucks comparable sales because the denominators and populations differ. Consumer Edge also cautions that relationships with 7 Brew’s geographic density do not establish direct switching or widespread migration; expansion contributes to its growth. Regional challengers therefore belong in U.S. prompt tests where local availability makes them relevant, not in every national shortlist by default. A test of a customised drink and fast pickup should first establish that each candidate can fulfil the request nearby. [8][17]
Starbucks’ April 2, 2026 EMEA announcement describes Protein Cold Foam with a company-reported 15 grams of whey protein per serving, in Vanilla and Caramel, including three featured iced drinks. This is the foam claim, not total protein in every beverage or a per-grande declaration. The source is regional, without an exhaustive country rollout list or exact foam serving volume. It cannot establish simultaneous availability throughout EMEA or identical Canadian and U.S. recipes. An assistant evaluating a Canadian breakfast should not import that declaration as local product evidence. [13]
Panera’s nutrition guide, effective November 4, 2026, Edition 1, provides a precise menu illustration: one Steak & Wake on Ciabatta is listed at 32 grams of protein and 520 kcal. It satisfies an illustrative minimum of 30 grams of protein but fails a 500-calorie ceiling. The listed figures do not establish a customised version’s nutrition, and the effective date is not a verified publication date. These constraints are examples of matching, not clinical guidance. A recommendation should pass every specified requirement, with the correct serving and modifiers, rather than receive credit merely for sounding healthy. [16][17]
The proposed Restaurant Choice Intelligence framework, discussed in the supplied draft as a possible Dig One research programme, would start with matched consumer occasions. A human study would capture unaided brand choice, consideration, taste, value and relevant preferences. Repeated AI tests would record recommended chains and items, rationale and verifiable menu facts under the same location, currency and constraints. The alignment layer would show where human choices and AI answers agree or diverge. This is an editorial measurement proposal, not a completed study, validated product claim or proof of vendor superiority. [17]
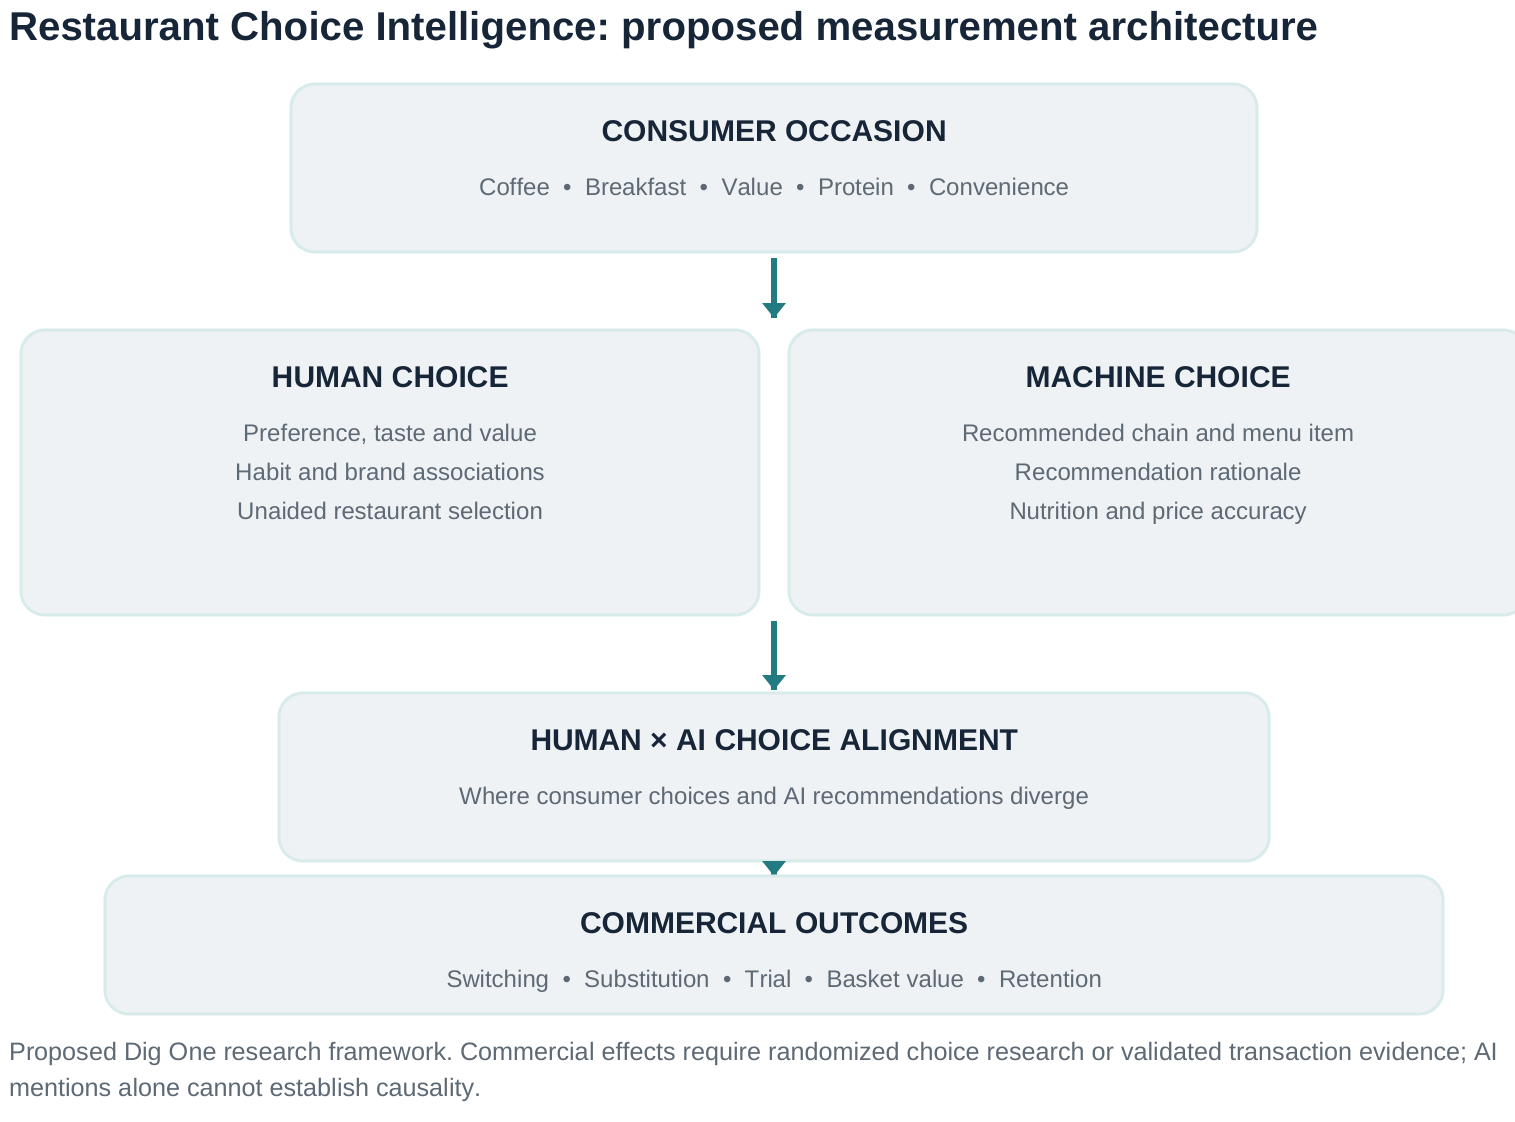
Occasion-specific recommendation share would count qualifying recommendations within a declared set of eligible prompts; human–AI agreement would compare matched choices. Menu accuracy would separately assess nutrition, prices, availability and modifiers, including false eligibility and omitted eligible options. Agreement might reinforce an existing preference without creating a sale, while disagreement might be ignored. Trial, switching, basket value, margin and retention belong in a separate commercial-outcomes layer. A diagram can connect those questions, but must not imply that alignment measures impact or that a recommendation automatically becomes a transaction. [17]
An illustrative machine baseline would run 100 selected prompts across five AI systems daily for 30 days, producing 15,000 executions, not 15,000 independent people. This design has not been conducted. Researchers would need to specify country coverage rather than assume the total applies separately to each country, record system versions and account conditions, preserve answers and citations, and account for repeated observations. Country-specific prompt sets should reflect real menus and geography instead of translating currency while leaving products unchanged. [17]
A separate human study would recruit Canadian and U.S. restaurant consumers with adequately powered, consent-based subgroups. After recording baseline choice, researchers could randomly assign participants to an AI recommendation, a structured non-AI comparison or a restaurant-owned interface. Keeping factual information comparable would help distinguish AI presentation from simply supplying a better menu comparison. Real or incentive-compatible choices and permissioned follow-up receipts would strengthen behavioural measurement; hypothetical intent alone would not establish actual purchase lift. Sample sizes and power requirements remain to be designed, not supplied by the execution count. [17]
The outcomes should distinguish new-to-brand trial, changed restaurant selection, beverage substitution, food attachment, visits and repeat purchase. Spend and contribution margin should remain separate: a higher-priced modified drink could replace another item rather than create incremental value. Randomised contrasts could support causal estimates only if implementation and analysis justify them. The published surveys, search estimates and financial results cannot be pooled into that experiment after the fact. [17]
GLP-1 research should collect medication information only with explicit consent, a clear purpose and suitable privacy protections. Treatment duration and actual preferences may be useful research variables, but no order should be used to infer a health condition or medication status. Non-users can express the same needs, and neither smaller portions nor protein preferences identify a medical subgroup. Health-related information should not silently become advertising, loyalty or recommendation targeting data. This proposal concerns consumer choice and menu accuracy, not prescribing, suitability advice or medical outcomes. [17]
Operationally, menu, digital, brand and research teams would need a shared evidence catalogue with country, location, serving, modifier, effective date and promotional terms. A quarterly review could compare recommendation errors with human choice and separately measured transactions, instead of treating a fluctuating mention score as a financial result. Independent assistants, branded experiences and ordering platforms should be assessed as different environments. The objective is accurate fulfilment of a stated need, including recognising when no verified option meets all constraints. [17]
AI-mediated discovery and changing restaurant baskets are distinct developments with a potentially important intersection. The supplied evidence supports testing whether needs-based recommendations expose suitable alternatives, reinforce routines or have little effect. It does not prove that GLP-1 adoption drives AI usage, that AI has caused brand performance changes or that every health-oriented consumer wants the same menu. For Canada, matched Tim Hortons, Starbucks and McDonald’s tests are useful; for the United States, Dunkin’ and locally available challengers broaden the comparison. [17]
The practical priority is to make menu facts verifiable, measure human–AI alignment and then test commercial consequences independently. A relevant recommendation is not yet an incremental sale. The wider questions of contextual choice and machine representation also connect with AEO Updates’ analyses of AI shopping across Walmart, Loblaw and Dollarama, national brands and private label in grocery AI search, and AI share of voice, recommendations and customer choice. [17]
This analysis reviews sixteen published research, company and menu documents, alongside an original editorial measurement proposal. Source review confirms what the reviewed documents report; it does not imply access to, or independent reproduction of, respondent-level, household, card, restaurant or laboratory data. Surveys, relative household spending, modelled branded searches, card-spending shares, company financial results and product announcements retain their own populations, dates and denominators. They are not pooled and do not establish a joint causal effect of GLP-1 use and AI discovery on sales. Undisclosed methods, inconsistent survey sample descriptions, product eligibility and current-availability limits are stated next to the relevant claims. Dates distinguish publication, fieldwork, observation and menu effective periods. Restaurant Choice Intelligence is a proposed research design, not a completed study or a validated causal funnel. Its illustrative 15,000 executions are repeated system tests, not independent people.
[3] GLP-1 Usage in Canada and the US
[4] The 2026 Restaurant Industry Trends Report | U.S. edition
[5] How Guests Discover New Restaurants in 2026
[7] Dunkin'® Celebrates 10K U.S. Location
[8] Coffee’s Affordable Indulgence Appeal Fuels Growth for Starbucks and Emerging Rivals
[9] Coffee chains in the United States: Which are most popular?
[10] Starbucks Reports Q4 and Full Fiscal Year 2026 Results
[11] Meet the beta Starbucks app in ChatGPT: A new way to discover your next favorite drink
[12] Building the future digital Starbucks experience
[13] Protein, done differently: Protein Cold Foam is here
[14] Restaurant Brands International Inc. Reports Third Quarter 2026 Results
[15] McDonald's Reports Third Quarter 2026 Results
[16] Panera Bread® Nutrition Guide | Effective November 4, 2026, Edition 1
[17] AI is changing restaurant discovery as GLP-1 users rethink their orders
This article links directly to the primary documentation, paper, filing or original reporting used for its material claims.